California's 13th congressional district
37°48′N 122°15′W / 37.8°N 122.25°W
| California's 13th congressional district | |
|---|---|
Interactive map of district boundaries since 2023 (Used in the 2022 elections) | |
| Representative | |
| Population (2023) | 784,322 |
| Median household income | $65,557[1] |
| Ethnicity |
|
| Cook PVI | R+1[2] |
.svg.png)
California's 13th congressional district is a congressional district in the U.S. state of California. Adam Gray, a Democrat, has represented this district since January 2025.
In the 2022 redistricting cycle, the district was moved to the San Joaquin Valley, while the old 13th district was renumbered as the 12th. The new 13th district includes all of Merced County; most of the population of Madera County; and parts of Stanislaus, Fresno, and San Joaquin counties. It includes the cities of Merced, Madera, Ceres, Patterson, Lathrop, Chowchilla, Atwater, Coalinga, and Mendota; as well as the southern parts of both Modesto and Turlock.[3] The new 13th district is considered a Democratic-leaning swing district. Despite that, Duarte was narrowly elected to represent it in 2022. As a result, it was one of 18 districts won by Republicans in 2022 that voted for Joe Biden in the 2020 presidential election. Two years later, it was one of 13 congressional districts that voted for Donald Trump in the 2024 presidential election while simultaneously electing a Democrat in the 2024 House of Representatives elections.[4]
Prior to the 2022 redistricting, the 13th district contained cities in the northwestern portion of Alameda County including Alameda, Albany, Berkeley, Emeryville, Oakland, Piedmont, and San Leandro.[5]
Recent election results from statewide races
| Year | Office | Results[6][7][8] |
|---|---|---|
| 2008 | President | Obama 54% - 45% |
| 2010 | Governor | Whitman 47.0% - 46.5% |
| Lt. Governor | Maldonado 51% - 39% | |
| Secretary of State | Bowen 46% - 45% | |
| Attorney General | Cooley 50% - 41% | |
| Treasurer | Lockyer 51% - 41% | |
| Controller | Chiang 52% - 40% | |
| 2012 | President | Obama 55% - 45% |
| 2014 | Governor | Brown 51% - 49% |
| 2016 | President | Clinton 53% - 41% |
| 2018 | Governor | Newsom 52% - 48% |
| Attorney General | Becerra 55% - 45% | |
| 2020 | President | Biden 54% - 43% |
| 2022 | Senate (Reg.) | Meuser 51% - 49% |
| Governor | Dahle 54% - 46% | |
| Lt. Governor | Underwood Jacobs 53% - 47% | |
| Secretary of State | Bernosky 52% - 48% | |
| Attorney General | Hochman 53% - 47% | |
| Treasurer | Guerrero 53% - 47% | |
| Controller | Chen 55% - 45% | |
| 2024 | President | Trump 51% - 46% |
| Senate (Reg.) | Garvey 52% - 48% |
Composition
| FIPS County Code[9] | County | Seat | Population |
|---|---|---|---|
| 19 | Fresno | Fresno | 1,017,162 |
| 39 | Madera | Madera | 162,858 |
| 47 | Merced | Merced | 291,920 |
| 77 | San Joaquin | Stockton | 800,965 |
| 99 | Stanislaus | Modesto | 551,430 |
Due to the 2020 redistricting, California's 13th congressional district has been moved geographically to the San Joaquin Valley. It encompasses Merced County, and parts of San Joaquin, Stanislaus, Madera, and Fresno Counties. The area in San Joaquin County includes the city of Lathrop. The area in Stanislaus County includes the southern halves of the cities of Modesto and Turlock; the cities of Ceres, Patterson, and Newman; and the census-designated places Empire, Airport, Rouse, Bystrom, Parklawn, Bret Harte, Riverdale Park, West Modesto, Keyes, Cowan, Monterey Park Tract, Grayson, Westley, Crows Landing, and Diablo Grande. The area in Madera County includes the cities of Chowchilla and Madera and the census-desiganted places Fairmead, Madera Acres, Parksdale, Parkwood, La Vina, Bonadelle Ranchos, and Madera Ranchos. The area in Fresno County includes the cities of Coalinga, Mendota, Kerman, Firebaugh, San Joaquin, and Huron; and the census-designated places Biola, Raisin City, Caruthers, Laton, Riverdale, Lanare, Tranquillity, Three Rocks, Cantua Creek, and Westside.
San Joaquin County is split between this district and the 9th district. They are partitioned by Union Pacific, Highway 380, S Tracy Blvd, the California Aqueduct, S Banta Rd, Highway 5, Paradise Cut, S Manthey Rd, Walthall Slough, E West Ripon Rd, Kincaid Rd, Hutchinson Rd, and Stanislaus River.
Stanislaus County is split between this district and the 5th district. They are partitioned by S Golden State Blvd, Highway J14, Union Pacific, Highway 99, N Golden State Blvd, Faith Home Rd, Rohde Rd, Moore Rd, Tuolumne River, Burlington Northern Santa Fe, Lateral No 2 Park, Viola St, Roble Ave, N Conejo Ave, N Carpenter Rd, Kansas Ave, Morse Rd, and Stanislaus River.
Madera County is split between this district and the 5th district. They are partitioned by Road 35, Road 36, Road 38, Madera Equalization Reservoir, River Rd, Avenue 21, Road 23, Avenue 27, Road 22 1/2, and Berenda Slough.
Fresno County is split between this district and the 21st district. They are partitioned by N Dickenson Ave, Highway 180, S Garfield Ave, W California Ave, S Grantland Ave, W Jensen Ave, S Chateau Fresno Ave, W North Ave, W American Ave, S Westlawn Ave, W Lincoln Ave, Shayes Ave, W Sumner Ave, S Cornelia Ave, W South Ave, S East Ave, E Mountain View Ave, S Sunnyside Ave, E Clemenceau Ave, S Fowler Ave, E Elkhorn Ave.
Cities and CDPs of 10,000 or more people
- Modesto – 218,464
- Merced – 86,333
- Turlock – 72,740
- Madera – 66,224
- Ceres – 49,302
- Los Banos – 45,532
- Atwater – 31,970
- Lathrop – 28,701
- Patterson – 23,781
- Chowchilla – 19,039
- Coalinga – 17,590
- Kerman – 16,016
- Mendota – 15,595
- Livingston – 14,172
- Newman – 12,351
- Winton – 11,709
- Delhi – 10,656
2,500 – 10,000 people
- Madera Acres – 9,162
- Firebaugh – 8,096
- Franklin – 6,919
- Huron – 6,206
- Gustine – 6,110
- West Modesto – 5,965
- Dos Palos – 5,798
- Keyes – 5,672
- Bonadelle Ranchos – 5,497
- Hilmar-Irwin – 5,164
- Bret Harte – 5,135
- McSwain – 4,480
- Empire – 4,202
- Planada – 4,164
- Bystrom – 3,957
- San Joaquin – 3,701
- Madera Ranchos – 3,623
- Riverdale – 3,477
- Parksdale – 3,234
- Caruthers – 2,613
List of members representing the district
| Member | Party | Dates | Cong ress |
Electoral history | Counties |
|---|---|---|---|---|---|
| District created March 4, 1933 | |||||
 Charles Kramer (Los Angeles) |
Democratic | March 4, 1933 – January 3, 1943 |
73rd 74th 75th 76th 77th |
Elected in 1932. Re-elected in 1934. Re-elected in 1936. Re-elected in 1938. Re-elected in 1940. Lost re-election. |
1933–1943 [data missing] |
 Norris Poulson (Los Angeles) |
Republican | January 3, 1943 – January 3, 1945 |
78th | Elected in 1942. Lost re-election. |
1943–1953 [data missing] |
 Ned R. Healy (Los Angeles) |
Democratic | January 3, 1945 – January 3, 1947 |
79th | Elected in 1944. Lost re-election. | |
 Norris Poulson (Los Angeles) |
Republican | January 3, 1947 – January 3, 1953 |
80th 81st 82nd |
Elected again in 1946. Re-elected in 1948. Re-elected in 1950. Redistricted to the 24th district. | |
.jpg) Ernest K. Bramblett (Pacific Grove) |
Republican | January 3, 1953 – January 3, 1955 |
83rd | Redistricted from the 11th district and re-elected in 1952. Retired. |
1953–1963 Monterey, San Luis Obispo, Santa Barbara, Ventura |
 Charles M. Teague (Santa Paula) |
Republican | January 3, 1955 – January 1, 1974 |
84th 85th 86th 87th 88th 89th 90th 91st 92nd 93rd |
Elected in 1954. Re-elected in 1956. Re-elected in 1958. Re-elected in 1960. Re-elected in 1962. Re-elected in 1964. Re-elected in 1966. Re-elected in 1968. Re-elected in 1970. Re-elected in 1972. Died. | |
| 1963–1967 Santa Barbara, Ventura | |||||
| 1967–1973 Southwestern Los Angeles, Santa Barbara, Ventura | |||||
| 1973–1975 Most of Santa Barbara and Ventura | |||||
| Vacant | January 1, 1974 – March 5, 1974 |
93rd | |||
 Robert J. Lagomarsino (Ojai) |
Republican | March 5, 1974 – January 3, 1975 |
Elected to finish Teague's term. Redistricted to the 19th district. | ||
 Norman Mineta (San Jose) |
Democratic | January 3, 1975 – January 3, 1993 |
94th 95th 96th 97th 98th 99th 100th 101st 102nd |
Elected in 1974. Re-elected in 1976. Re-elected in 1978. Re-elected in 1980. Re-elected in 1982. Re-elected in 1984. Re-elected in 1986. Re-elected in 1988. Re-elected in 1990. Redistricted to the 15th district. |
1975–1983 Santa Clara |
| 1983–1993 Santa Clara (western San Jose) | |||||
 Pete Stark (Fremont) |
Democratic | January 3, 1993 – January 3, 2013 |
103rd 104th 105th 106th 107th 108th 109th 110th 111th 112th |
Redistricted from the 9th district and re-elected in 1992. Re-elected in 1994. Re-elected in 1996. Re-elected in 1998. Re-elected in 2000. Re-elected in 2002. Re-elected in 2004. Re-elected in 2006. Re-elected in 2008. Re-elected in 2010. Redistricted to the 15th district and lost re-election. |
1993–2003 Western Alameda, small part of northern Santa Clara |
2003–2013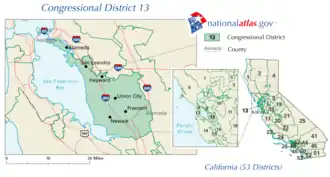 Southwestern Alameda | |||||
 Barbara Lee (Oakland) |
Democratic | January 3, 2013 – January 3, 2023 |
113th 114th 115th 116th 117th |
Redistricted from the 9th district and re-elected in 2012. Re-elected in 2014. Re-elected in 2016. Re-elected in 2018. Re-elected in 2020. Redistricted to the 12th district. |
2013–2023.tif.png) Northern Alameda |
 John Duarte (Modesto) |
Republican | January 3, 2023 – January 3, 2025 |
118th | Elected in 2022. Lost re-election. |
2023–present_(new_version).svg.png) San Joaquin Valley, all of Merced County; including all of Madera parts of Stanislaus, Fresno, and San Joaquin |
.jpg) Adam Gray (Merced) |
Democratic | January 3, 2025 – present |
119th | Elected in 2024. | |
Election results
|
1932 • 1934 • 1936 • 1938 • 1940 • 1942 • 1944 • 1946 • 1948 • 1950 • 1952 • 1954 • 1956 • 1958 • 1960 • 1962 • 1964 • 1966 • 1968 • 1970 • 1972 • 1974 (Special) • 1974 • 1976 • 1978 • 1980 • 1982 • 1984 • 1986 • 1988 • 1990 • 1992 • 1994 • 1996 • 1998 • 2000 • 2002 • 2004 • 2006 • 2008 • 2010 • 2012 • 2014 • 2016 • 2018 • 2020 • 2022 • 2024 |
1932
| Party | Candidate | Votes | % | ||
|---|---|---|---|---|---|
| Democratic | Charles Kramer | 65,261 | 52.7 | ||
| Republican | Charles H. Randall | 53,449 | 43.1 | ||
| Liberty | George D. Higgins | 5,237 | 4.2 | ||
| Total votes | 123,947 | 100.0 | |||
| Turnout | |||||
| Democratic win (new seat) | |||||
1934
| Party | Candidate | Votes | % | |
|---|---|---|---|---|
| Democratic | Charles Kramer (Incumbent) | 83,384 | 62.5 | |
| Republican | Thomas K. Case | 27,993 | 21.0 | |
| Prohibition | Charles H. Randall | 18,760 | 14.1 | |
| Socialist | Michael S. Kerrigan | 2,113 | 1.6 | |
| Communist | John J. Graham | 1,268 | 0.9 | |
| Total votes | 133,518 | 100.0 | ||
| Turnout | ||||
| Democratic hold | ||||
1936
| Party | Candidate | Votes | % | |
|---|---|---|---|---|
| Democratic | Charles Kramer (Incumbent) | 119,251 | 90.0 | |
| No party | Floyd Seaman (write-in) | 6,946 | 5.2 | |
| Communist | Emma Cutler | 6,362 | 4.8 | |
| Total votes | 132,559 | 100.0 | ||
| Turnout | ||||
| Democratic hold | ||||
1938
| Party | Candidate | Votes | % | |
|---|---|---|---|---|
| Democratic | Charles Kramer (Incumbent) | 96,258 | 65.9 | |
| Republican | K. L. Stockton | 44,808 | 30.7 | |
| Communist | Louis Baron | 5,104 | 3.4 | |
| Total votes | 146,170 | 100.0 | ||
| Turnout | ||||
| Democratic hold | ||||
1940
| Party | Candidate | Votes | % | |
|---|---|---|---|---|
| Democratic | Charles Kramer (Incumbent) | 127,167 | 75.7 | |
| Prohibition | Charles H. Randall | 36,406 | 21.7 | |
| Communist | Celeste Strack | 4,434 | 2.6 | |
| Total votes | 168,007 | 100.0 | ||
| Turnout | ||||
| Democratic hold | ||||
1942
| Party | Candidate | Votes | % | |||
|---|---|---|---|---|---|---|
| Republican | Norris Poulson | 38,577 | 49.5 | |||
| Democratic | Charles Kramer (Incumbent) | 33,060 | 42.4 | |||
| Townsend | Calvert S. Wilson | 6,306 | 8.1 | |||
| Total votes | 77,943 | 100.0 | ||||
| Turnout | ||||||
| Republican gain from Democratic | ||||||
1944
| Party | Candidate | Votes | % | |||
|---|---|---|---|---|---|---|
| Democratic | Ned R. Healy | 66,854 | 55 | |||
| Republican | Norris Poulson (Incumbent) | 54,792 | 45 | |||
| Total votes | 121,646 | 100 | ||||
| Turnout | ||||||
| Democratic gain from Republican | ||||||
1946
| Party | Candidate | Votes | % | |||
|---|---|---|---|---|---|---|
| Republican | Norris Poulson | 48,071 | 51.8 | |||
| Democratic | Ned R. Healy (Incumbent) | 44,712 | 48.2 | |||
| Total votes | 92,783 | 100.0 | ||||
| Turnout | ||||||
| Republican gain from Democratic | ||||||
1948
| Party | Candidate | Votes | % | |
|---|---|---|---|---|
| Republican | Norris Poulson (Incumbent) | 62,951 | 52.6 | |
| Democratic | Ned R. Healy | 56,624 | 47.4 | |
| Total votes | 119,575 | 100.0 | ||
| Turnout | ||||
| Republican hold | ||||
1950
| Party | Candidate | Votes | % | |
|---|---|---|---|---|
| Republican | Norris Poulson (Incumbent) | 83,296 | 84.9 | |
| Progressive | Ellen P. Davidson | 14,789 | 15.1 | |
| Total votes | 98,085 | 100.0 | ||
| Turnout | ||||
| Republican hold | ||||
1952
| Party | Candidate | Votes | % | |
|---|---|---|---|---|
| Republican | Ernest K. Bramblett (Incumbent) | 79,496 | 51 | |
| Democratic | Will Hays | 76,516 | 49 | |
| Total votes | 156,012 | 100 | ||
| Turnout | ||||
| Republican hold | ||||
1954
| Party | Candidate | Votes | % | |
|---|---|---|---|---|
| Republican | Charles M. Teague | 69,287 | 52.5 | |
| Democratic | Timothy I. O'Reilly | 62,786 | 47.5 | |
| Total votes | 132,073 | 100.0 | ||
| Turnout | ||||
| Republican hold | ||||
1956
| Party | Candidate | Votes | % | |
|---|---|---|---|---|
| Republican | Charles M. Teague (Incumbent) | 104,009 | 59.6 | |
| Democratic | William Kirk Stewart | 70,567 | 40.4 | |
| Total votes | 174,576 | 100.0 | ||
| Turnout | ||||
| Republican hold | ||||
1958
| Party | Candidate | Votes | % | |
|---|---|---|---|---|
| Republican | Charles M. Teague (Incumbent) | 98,381 | 57 | |
| Democratic | William Kirk Stewart | 74,160 | 43 | |
| Total votes | 172,541 | 100 | ||
| Turnout | ||||
| Republican hold | ||||
1960
| Party | Candidate | Votes | % | |
|---|---|---|---|---|
| Republican | Charles M. Teague (Incumbent) | 146,072 | 65 | |
| Democratic | George J. Holgate | 78,597 | 35 | |
| Total votes | 224,669 | 100 | ||
| Turnout | ||||
| Republican hold | ||||
1962
| Party | Candidate | Votes | % | |
|---|---|---|---|---|
| Republican | Charles M. Teague (Incumbent) | 84,743 | 64.9 | |
| Democratic | George J. Holgate | 45,746 | 35.1 | |
| Total votes | 130,489 | 100.0 | ||
| Turnout | ||||
| Republican hold | ||||
1964
| Party | Candidate | Votes | % | |
|---|---|---|---|---|
| Republican | Charles M. Teague (Incumbent) | 104,744 | 57.4 | |
| Democratic | George E. Taylor | 77,763 | 42.6 | |
| Total votes | 182,507 | 100.0 | ||
| Turnout | ||||
| Republican hold | ||||
1966
| Party | Candidate | Votes | % | |
|---|---|---|---|---|
| Republican | Charles M. Teague (Incumbent) | 116,701 | 67.5 | |
| Democratic | Charles A. Storke | 56,240 | 32.5 | |
| Total votes | 172,941 | 100.0 | ||
| Turnout | ||||
| Republican hold | ||||
1968
| Party | Candidate | Votes | % | |
|---|---|---|---|---|
| Republican | Charles M. Teague (Incumbent) | 148,357 | 65.9 | |
| Democratic | Stanley K. Sheinbaum | 76,928 | 34.1 | |
| Total votes | 225,285 | 100.0 | ||
| Turnout | ||||
| Republican hold | ||||
1970
| Party | Candidate | Votes | % | |
|---|---|---|---|---|
| Republican | Charles M. Teague (Incumbent) | 125,507 | 58.2 | |
| Democratic | Gary K. Hart | 87,980 | 40.8 | |
| American Independent | Maude I. Jordet | 2,339 | 1.0 | |
| Total votes | 215,826 | 100.0 | ||
| Turnout | ||||
| Republican hold | ||||
1972
| Party | Candidate | Votes | % | |
|---|---|---|---|---|
| Republican | Charles M. Teague (Incumbent) | 153,723 | 73.9 | |
| Democratic | Lester Dean Cleveland | 54,237 | 27.1 | |
| Total votes | 207,960 | 100.0 | ||
| Turnout | ||||
| Republican hold | ||||
1974 (Special)
| Party | Candidate | Votes | % | |
|---|---|---|---|---|
| Republican | Robert J. Lagomarsino | 53.7 | ||
| Democratic | James D. Loebl | 18.8 | ||
| Democratic | James A. Browning Jr. | 7.8 | ||
| Democratic | Roger A. Ikola | 6.3 | ||
| Democratic | E.T. "Tom" Jolicoeur | 6.0 | ||
| Democratic | David H. Miller | 3.2 | ||
| Democratic | R.W. Handley | 2.4 | ||
| Democratic | F. Joe Deauchamp | 1.9 | ||
| Total votes | 100.0 | |||
| Turnout | ||||
| Republican hold | ||||
1974
| Party | Candidate | Votes | % | |||
|---|---|---|---|---|---|---|
| Democratic | Norm Mineta | 78,649 | 52.6 | |||
| Republican | George W. Milias | 63,381 | 42.4 | |||
| Peace and Freedom | Elizabeth Cervantes Barron | 3,846 | 2.6 | |||
| American Independent | Floyd S. Stancliffe | 3,738 | 2.5 | |||
| Total votes | 149,614 | 100.0 | ||||
| Turnout | ||||||
| Democratic gain from Republican | ||||||
1976
| Party | Candidate | Votes | % | |
|---|---|---|---|---|
| Democratic | Norm Mineta (Incumbent) | 135,291 | 66.8 | |
| Republican | Ernie Konnyu | 63,130 | 31.2 | |
| American Independent | William Pollock Herrell | 4,190 | 2.1 | |
| Total votes | 202,611 | 100.0 | ||
| Turnout | ||||
| Democratic hold | ||||
1978
| Party | Candidate | Votes | % | |
|---|---|---|---|---|
| Democratic | Norm Mineta (Incumbent) | 100,809 | 57.5 | |
| Republican | Dan O'Keefe | 69,306 | 39.5 | |
| Peace and Freedom | Robert Goldsborough III | 5,246 | 3.0 | |
| Total votes | 175,361 | 100.0 | ||
| Turnout | ||||
| Democratic hold | ||||
1980
| Party | Candidate | Votes | % | |
|---|---|---|---|---|
| Democratic | Norm Mineta (Incumbent) | 132,246 | 58.9 | |
| Republican | W. E. "Ted" Gagne | 79,766 | 35.5 | |
| Libertarian | Ray Strong | 8,806 | 3.9 | |
| Peace and Freedom | Robert Goldsborough | 3,791 | 1.7 | |
| Total votes | 224,609 | 100.0 | ||
| Turnout | ||||
| Democratic hold | ||||
1982
| Party | Candidate | Votes | % | |
|---|---|---|---|---|
| Democratic | Norm Mineta (Incumbent) | 110,805 | 65.9 | |
| Republican | Tom Kelly | 52,806 | 31.4 | |
| Libertarian | Al Hinkle | 4,553 | 2.7 | |
| Total votes | 168,164 | 100.0 | ||
| Turnout | ||||
| Democratic hold | ||||
1984
| Party | Candidate | Votes | % | |
|---|---|---|---|---|
| Democratic | Norm Mineta (Incumbent) | 139,851 | 65.2 | |
| Republican | John D. "Jack" Williams | 70,666 | 33.0 | |
| Libertarian | John R. Redding | 3,836 | 1.8 | |
| Total votes | 214,353 | 100.0 | ||
| Turnout | ||||
| Democratic hold | ||||
1986
| Party | Candidate | Votes | % | |
|---|---|---|---|---|
| Democratic | Norm Mineta (Incumbent) | 107,696 | 69.7 | |
| Republican | Bob Nash | 46,754 | 30.3 | |
| Total votes | 154,450 | 100.0 | ||
| Turnout | ||||
| Democratic hold | ||||
1988
| Party | Candidate | Votes | % | |
|---|---|---|---|---|
| Democratic | Norm Mineta (Incumbent) | 143,980 | 67.1 | |
| Republican | Luke Somner | 63,959 | 29.8 | |
| Libertarian | John H. Webster | 6,583 | 3.1 | |
| Total votes | 214,522 | 100.0 | ||
| Turnout | ||||
| Democratic hold | ||||
1990
| Party | Candidate | Votes | % | |
|---|---|---|---|---|
| Democratic | Norm Mineta (Incumbent) | 97,286 | 58.0 | |
| Republican | David E. Smith | 59,773 | 35.7 | |
| Libertarian | John H. Webster | 10,587 | 6.3 | |
| Total votes | 167,646 | 100.0 | ||
| Turnout | ||||
| Democratic hold | ||||
1992
| Party | Candidate | Votes | % | |
|---|---|---|---|---|
| Democratic | Pete Stark (Incumbent) | 123,795 | 60.2 | |
| Republican | Verne W. Teyler | 64,953 | 31.6 | |
| Peace and Freedom | Roslyn A. Allen | 16,768 | 8.2 | |
| Total votes | 205,516 | 100.0 | ||
| Turnout | ||||
| Democratic hold | ||||
1994
| Party | Candidate | Votes | % | |
|---|---|---|---|---|
| Democratic | Pete Stark (Incumbent) | 97,344 | 64.62 | |
| Republican | Larry Molton | 45,555 | 30.24 | |
| Libertarian | Robert "Bob" Gough | 7,743 | 5.14 | |
| Total votes | 150,642 | 100.00 | ||
| Turnout | ||||
| Democratic hold | ||||
1996
| Party | Candidate | Votes | % | |
|---|---|---|---|---|
| Democratic | Pete Stark (Incumbent) | 114,408 | 65.2 | |
| Republican | James Fay | 53,385 | 30.4 | |
| Libertarian | Terry Savage | 7,746 | 4.4 | |
| Total votes | 176,539 | 100.0 | ||
| Turnout | ||||
| Democratic hold | ||||
1998
| Party | Candidate | Votes | % | |
|---|---|---|---|---|
| Democratic | Pete Stark (Incumbent) | 101,671 | 71.20 | |
| Republican | James R. Goetz | 38,050 | 26.65 | |
| Natural Law | Karnig Beylikjian | 3,066 | 2.15 | |
| Total votes | 142,787 | 100.0 | ||
| Turnout | ||||
| Democratic hold | ||||
2000
| Party | Candidate | Votes | % | |
|---|---|---|---|---|
| Democratic | Pete Stark (Incumbent) | 129,012 | 70.5 | |
| Republican | James R. "Jim" Goetz | 44,499 | 24.3 | |
| Libertarian | Howard Mora | 4,623 | 2.6 | |
| Natural Law | Timothy R. Hoehner | 2,647 | 1.4 | |
| American Independent | Don J. Grundmann | 2,365 | 1.2 | |
| Total votes | 183,146 | 100.0 | ||
| Turnout | ||||
| Democratic hold | ||||
2002
| Party | Candidate | Votes | % | |
|---|---|---|---|---|
| Democratic | Pete Stark (Incumbent) | 86,495 | 71.1 | |
| Republican | Syed R. Mahmoud | 26,852 | 22.1 | |
| Libertarian | Mark R. Stroberg | 3,703 | 3.1 | |
| American Independent | Don J. Grundmann | 2,772 | 2.2 | |
| Reform | John J. Bambey | 1,901 | 1.5 | |
| Total votes | 121,723 | 100.0 | ||
| Turnout | ||||
| Democratic hold | ||||
2004
| Party | Candidate | Votes | % | |
|---|---|---|---|---|
| Democratic | Pete Stark (Incumbent) | 144,605 | 71.7 | |
| Republican | George I. Bruno | 48,439 | 28.2 | |
| Libertarian | Mark R. Stroberg | 8,877 | 4.3 | |
| Total votes | 201,921 | 100.0 | ||
| Turnout | ||||
| Democratic hold | ||||
2006
| Party | Candidate | Votes | % | |
|---|---|---|---|---|
| Democratic | Pete Stark (Incumbent) | 144,409 | 74.9 | |
| Republican | George I. Bruno | 27,141 | 25.1 | |
| Total votes | 171,500 | 100.0 | ||
| Turnout | ||||
| Democratic hold | ||||
2008
| Party | Candidate | Votes | % | |
|---|---|---|---|---|
| Democratic | Pete Stark (Incumbent) | 166,829 | 76.5 | |
| Republican | Raymond Chui | 51,447 | 23.5 | |
| Total votes | 218,276 | 100.0 | ||
| Turnout | ||||
| Democratic hold | ||||
2010
| Party | Candidate | Votes | % | |
|---|---|---|---|---|
| Democratic | Pete Stark (Incumbent) | 118,278 | 72.19 | |
| Republican | Forest Baker | 45,545 | 27.81 | |
| Democratic hold | ||||
2012
| Party | Candidate | Votes | % | |
|---|---|---|---|---|
| Democratic | Barbara Lee (Incumbent) | 250,436 | 87% | |
| No party preference | Marilyn M. Singleton | 38,146 | 13% | |
| Total votes | 288,582 | 100.0% | ||
| Democratic hold | ||||
2014
| Party | Candidate | Votes | % | |
|---|---|---|---|---|
| Democratic | Barbara Lee (Incumbent) | 168,491 | 89% | |
| Republican | Dakin Sundeen | 21,940 | 11% | |
| Total votes | 190,431 | 100.0% | ||
| Democratic hold | ||||
2016
| Party | Candidate | Votes | % | |
|---|---|---|---|---|
| Democratic | Barbara Lee (Incumbent) | 293,117 | 91% | |
| Republican | Sue Caro | 29,754 | 9% | |
| Total votes | 322,871 | 100.0% | ||
| Democratic hold | ||||
2018
| Party | Candidate | Votes | % | |
|---|---|---|---|---|
| Democratic | Barbara Lee (Incumbent) | 260,580 | 88% | |
| Green | Laura Wells | 34,257 | 11% | |
| Total votes | 294,837 | 100.0% | ||
| Democratic hold | ||||
2020
| Party | Candidate | Votes | % | |
|---|---|---|---|---|
| Democratic | Barbara Lee (incumbent) | 327,863 | 90.4 | |
| Republican | Nikka Piterman | 34,955 | 9.6 | |
| Total votes | 362,818 | 100.0 | ||
| Democratic hold | ||||
2022
| Party | Candidate | Votes | % | |
|---|---|---|---|---|
| Republican | John Duarte | 67,060 | 50.2 | |
| Democratic | Adam Gray | 66,496 | 49.8 | |
| Total votes | 133,556 | 100.0 | ||
| Republican gain from Democratic | ||||
2024
| Party | Candidate | Votes | % | |
|---|---|---|---|---|
| Democratic | Adam Gray | 105,554 | 50.0 | |
| Republican | John Duarte (incumbent) | 105,367 | 50.0 | |
| Total votes | 210,921 | 100.0 | ||
| Democratic gain from Republican | ||||
See also
References
- ^ "My Congressional District".
- ^ "2025 Cook PVI℠: District Map and List (119th Congress)". Cook Political Report. Retrieved April 5, 2025.
- ^ "CA 2022 Congressional". Dave's Redistricting. January 4, 2022. Retrieved November 11, 2022.
- ^ Bowman, Bridget (December 14, 2024). "Trump's victory sets up fight for the House on his turf in 2026". NBC News. Retrieved March 16, 2025.
- ^ "Maps: Final Congressional Districts". Citizens Redistricting Commission. Archived from the original on March 10, 2013. Retrieved February 25, 2013.
- ^ https://davesredistricting.org/maps#viewmap::fc9d2d06-7c7f-451c-92cb-122127a79c29
- ^ "Supplement to Statement of Vote" (PDF). November 8, 2022. Archived (PDF) from the original on January 8, 2025. Retrieved January 21, 2025.
- ^ "Supplement to Statement of Vote" (PDF). November 5, 2024. Archived (PDF) from the original on April 9, 2025. Retrieved April 5, 2025.
- ^ "California FIPS Codes". National Weather Service. Retrieved March 11, 2025.
- ^ "1932 election results" (PDF).
- ^ "1934 election results" (PDF).
- ^ "1936 election results" (PDF).
- ^ "1938 election results" (PDF).
- ^ "1940 election results" (PDF).
- ^ "1942 election results" (PDF).
- ^ "1944 election results" (PDF).
- ^ "1946 election results" (PDF).
- ^ "1948 election results" (PDF).
- ^ "1950 election results" (PDF).
- ^ "1952 election results" (PDF).
- ^ "1954 election results" (PDF).
- ^ "1956 election results" (PDF).
- ^ "1958 election results" (PDF).
- ^ "1960 election results" (PDF).
- ^ "1962 election results" (PDF).
- ^ "1964 election results" (PDF).
- ^ "1966 election results" (PDF).
- ^ "1968 election results" (PDF).
- ^ "1970 election results" (PDF).
- ^ "1972 election results" (PDF).
- ^ "JoinCalifornia - 03-05-1974 Election". www.joincalifornia.com.
- ^ "1974 election results" (PDF).
- ^ "1976 election results" (PDF).
- ^ "1978 election results" (PDF).
- ^ "1980 election results" (PDF).
- ^ "1982 election results" (PDF).
- ^ "1984 election results" (PDF).
- ^ "1986 election results" (PDF).
- ^ "1988 election results" (PDF).
- ^ "1990 election results" (PDF).
- ^ "1992 election results" (PDF).
- ^ "1994 election results" (PDF).
- ^ "1996 election results" (PDF).
- ^ "1998 election results" (PDF).
- ^ "2000 election results" (PDF).
- ^ "2002 general election results" (PDF). Archived from the original (PDF) on February 3, 2009.
- ^ "2004 general election results" (PDF). Archived from the original (PDF) on August 21, 2008.
- ^ "2006 general election results" (PDF). Archived from the original (PDF) on November 27, 2008.
- ^ "2008 general election results" (PDF). Archived from the original (PDF) on October 18, 2012. Retrieved January 5, 2009.
- ^ "2010 general election results" (PDF). Archived from the original (PDF) on June 11, 2014. Retrieved March 24, 2011.
- ^ a b "2012 general election results" (PDF). Archived from the original (PDF) on October 19, 2013.
External links
- GovTrack.us: California's 13th congressional district
- RAND California Election Returns: District Definitions (out of date)
- California Voter Foundation map - CD13 (out of date)