California's 28th congressional district
| California's 28th congressional district | |
|---|---|
Interactive map of district boundaries since January 3, 2023 | |
| Representative | |
| Population (2023) | 746,863 |
| Median household income | $104,238[1] |
| Ethnicity |
|
| Cook PVI | D+15[2] |
.svg.png)
California's 28th congressional district is a congressional district in the U.S. state of California, in Los Angeles County. The district is regarded as a Democratic stronghold and has been held by the Democratic Party since 2003[3] and is currently represented by Democrat Judy Chu.
Following redistricting ahead of the 2022 election cycle, the 18th district was relocated to the San Gabriel Valley.
Formerly, from 2003 to 2013, the district included about half of the San Fernando Valley, including North Hollywood, in the Greater Los Angeles Area. Due to redistricting after the 2010 United States census, the district shifted east within Los Angeles County and includes portions of Burbank and Glendale.
Recent election results from statewide races
| Year | Office | Results[4][5][6] |
|---|---|---|
| 2008 | President | Obama 61% - 38% |
| 2010 | Governor | Brown 54% - 42% |
| Lt. Governor | Newsom 52% - 38% | |
| Secretary of State | Bowen 54% - 38% | |
| Attorney General | Cooley 50% - 44% | |
| Treasurer | Lockyer 58% - 36% | |
| Controller | Chiang 56% - 37% | |
| 2012 | President | Obama 62% - 38% |
| 2014 | Governor | Brown 60% - 40% |
| 2016 | President | Clinton 64% - 30% |
| 2018 | Governor | Newsom 63% - 37% |
| Attorney General | Becerra 65% - 35% | |
| 2020 | President | Biden 66% - 32% |
| 2022 | Senate (Reg.) | Padilla 65% - 35% |
| Governor | Newsom 63% - 37% | |
| Lt. Governor | Kounalakis 63% - 37% | |
| Secretary of State | Weber 63% - 37% | |
| Attorney General | Bonta 62% - 38% | |
| Treasurer | Ma 63% - 37% | |
| Controller | Cohen 56% - 44% | |
| 2024 | President | Harris 62% - 35% |
| Senate (Reg.) | Schiff 62% - 38% |
Composition
| FIPS County Code[7] | County | Seat | Population |
|---|---|---|---|
| 37 | Los Angeles | Los Angeles | 9,663,345 |
| 71 | San Bernardino | San Bernardino | 2,195,611 |
Under the 2020 redistricting, California's 28th congressional district is located in Southern California, encompassing most of northeastern Los Angeles County, and part of the eastern border of San Bernardino County. A majority of the district is taken up by Angeles National Forest. The area in Los Angeles County also includes the north side of the cities of Glendora and Monrovia; part of the city of Pasadena; the cities of Alhambra, Monterey Park, Arcadia, Glendora, Rosemead, San Gabriel, Claremont, Temple City, La Cañada Flintridge, South Pasadena, San Marino, and Sierra Madre; and the census-designated places Altadena, South San Gabriel, East San Gabriel, East Pasadena, San Pasqual, and La Crescenta-Montrose. The area in San Bernardino County includes the north side of the cities of Upland and Rancho Cucamonga; and the census-designated places San Antonio Heights, Lytle Creek, and Wrightwood.
Los Angeles County is split between this district, the 23rd district, the 30th district, the 31st district, the 34th district, the 35th district, and the 38th district. The 28th and 23rd are partitioned by Angeles National Forest and Juniper Hills Rd.
The 28th and 30th are partitioned by Angeles National Forest, Big Tujunga Creek, Big Tujunga Canyon Rd, Silver Creek, Markridge Rd, Pennsylvania Ave, Northwoods Ln, Ramsdell Ave, Fairway Ave, La Crescenta Ave, Mayfield Ave, Rosemont Ave, Florencita Ave, Thompson Ct, Park Pl, Verdugo Blvd, La Tour Way, Descanso Gardens, Norham Pl, Wendover Rd, Linda Vista Ave, Oak Grove Dr, Yucca Ln, W Montana St, Vermont St, Forest Ave, Wyoming St, Lincoln Ave, Anderson Pl, Canada Pl, Highway 210, W Hammond St, Glen Ave, W Mountain St, Manzanita Ave, N Orange Grove Blvd, and Ventura Freeway.
The 28th and 31st are partitioned by Rio Hondo River, Garvey Ave, Highway 19, Highway 10, Eaton Wash, Temple City Blvd, Valley Blvd, Ellis Ln, Lower Azusa Rd, Grande Ave, Santa Anita Ave, Lynrose St, Flood Control Basin, Peck Rd, Randolph St, Cogswell Rd, Clark St, Durfree Ave, Santa Anita Wash, S 10th Ave, Jeffries Ave, Mayflower/Fairgreen Ave, Alta Vista/Fairgreen Ave, El Norte Ave, S 5th Ave, Valencia Way/N 5th Ave, Hillcrest Blvd, E Hillcrest Blvd, Grand Ave, E Greystone Ave, N Bradoaks Ave, Angeles National Forest, W Fork Rd, Highway 39, Cedar Creek, Iron Fork, Glendora Mountain Rd, Morris Reservoir, W Sierra Madre Ave, N Lorraine Ave, E Foothill Blvd, E Carroll Ave, Steffen St, S Lorraine Ave, AT and SF Railway, E Route 66, N Cataract Ave, San Dimas Canyon Rd, Clayton Ct, Live Oak Canyon, Rotary Dr, Highway 30, Williams Ave, Highway 210, Garey Ave, and Summer Ave.
The 28th and 34th are partitioned by Colorado Blvd, Lantana Dr, Church St, Adelaide Pl, Highway 110, N Huntingdon Dr, S Winchester Ave, Valley Blvd, Laguna Channel, Highway 710, l-10 Express Ln, Rollins Dr, Floral Dr, E Colonia, Belvedere Park, Highway 60, S Atlantic Blvd, and Pomona Blvd.
The 28th and 35th are partitioned by Towne Ave, Harrison Ave, Carnegie Ave, W Arrow Highway, Mountain Ave, and E American Ave.
The 28th and 38th are partitioned by E Pomona Blvd, Potrero Grande Dr, Arroyo Dr, Hill Dr, Montebello Blvd, N San Gabriel Blvd, and Walnut Grove Ave.
San Bernardino County is split between this district, the 23rd district, the 33rd district, and the 35th district. They are partitioned by San Bernardino National Forest, Manzanita Rd, Highway 15, Cajon Blvd, W Kenwood Ave, Highway 215, W Meyers Rd, Ohio Ave, Pine Ave, Bailey Ct, Highway 206, Devils Canyon Rd, Cloudland Truck Trail, Cloudland Cutoff, Hill Dr, W 54th St, E Hill Dr, Bonita Vista Dr, Sterling Ave, Argyle Ave, E Marshall Blvd, Rockford Ave, Lynwood Dr, La Praix St, Orchid Dr, Denair Ave, Highland Ave, Orchard Rd, Arroyo Vista Dr, Church St, Greensport Rd, Florida St, Garnet St, Nice Ave, Crafton Ave, 5th Ave, Walnut St, 6th Ave, S Wabash Ave, E Citrus Ave, N Church St, Southern California Regional Rail A, Tennessee St, Highway 10, California St, E Washington St, and S Barton Rd.
Cities and CDPs with 10,000 or more people
- Rancho Cucamonga – 174,405
- Pasadena – 138,699
- Alhambra – 82,868
- Upland – 79,040
- Monterey Park – 59,667
- Arcadia – 56,681
- Glendora – 52,558
- Rosemead – 51,185
- Altadena – 42,846
- San Gabriel – 39,568
- Monrovia – 37,931
- Claremont – 37,266
- Temple City – 36,494
- South Pasadena – 26,943
- East San Gabriel – 22,679
- La Cañada Flintridge – 20,573
- La Crescenta-Montrose – 19,997
- San Marino – 12,513
- Sierra Madre – 10,809
2,500 – 10,000 people
- South San Gabriel – 7,920
- East Pasadena – 6,021
- Wrightwood – 4,720
- San Antonio Heights – 3,441
List of members representing the district
| Member | Party | Dates | Cong ress(es) |
Electoral history | Counties |
|---|---|---|---|---|---|
| District created January 3, 1953 | |||||
 James B. Utt (Santa Ana) |
Republican | January 3, 1953 – January 3, 1963 |
83rd 84th 85th 86th 87th |
Elected in 1952. Re-elected in 1954. Re-elected in 1956. Re-elected in 1958. Re-elected in 1960. Redistricted to the 35th district. |
1953–1963 Orange, Northwestern San Diego |
 Alphonzo E. Bell Jr. (Los Angeles) |
Republican | January 3, 1963 – January 3, 1975 |
88th 89th 90th 91st 92nd 93rd |
Redistricted from the 16th district and re-elected in 1962. Re-elected in 1964. Re-elected in 1966. Re-elected in 1968. Re-elected in 1970. Re-elected in 1972. Redistricted to the 27th district. |
1963–1969 Los Angeles |
| 1969–1973 Los Angeles | |||||
| 1973–1975 Los Angeles | |||||
 Yvonne Brathwaite Burke (Los Angeles) |
Democratic | January 3, 1975 – January 3, 1979 |
94th 95th |
Redistricted from the 37th district and re-elected in 1974. Re-elected in 1976. Retired to run for Attorney General. |
1975–1983 Los Angeles |
 Julian C. Dixon (Culver City) |
Democratic | January 3, 1979 – January 3, 1993 |
96th 97th 98th 99th 100th 101st 102nd |
Elected in 1978. Re-elected in 1980. Re-elected in 1982. Re-elected in 1984. Re-elected in 1986. Re-elected in 1988. Re-elected in 1990. Redistricted to the 32nd district. | |
| 1983–1993 Southern Los Angeles (Inglewood) | |||||
 David Dreier (San Dimas) |
Republican | January 3, 1993 – January 3, 2003 |
103rd 104th 105th 106th 107th |
Redistricted from the 33rd district and re-elected in 1992. Re-elected in 1994. Re-elected in 1996. Re-elected in 1998. Re-elected in 2000. Redistricted to the 26th district. |
1993–2003 Los Angeles (Eastern suburbs) |
 Howard Berman (Los Angeles) |
Democratic | January 3, 2003 – January 3, 2013 |
108th 109th 110th 111th 112th |
Redistricted from the 26th district and re-elected in 2002. Re-elected in 2004. Re-elected in 2006. Re-elected in 2008. Re-elected in 2010. Redistricted to the 30th district and lost. |
2003–2013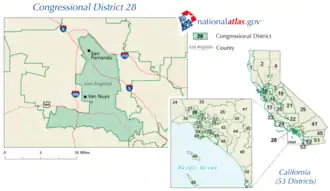 Los Angeles (San Fernando, Van Nuys) |
.jpg) Adam Schiff (Burbank) |
Democratic | January 3, 2013 – January 3, 2023 |
113th 114th 115th 116th 117th |
Redistricted from the 29th district and re-elected in 2012. Re-elected in 2014. Re-elected in 2016. Re-elected in 2018. Re-elected in 2020. Redistricted to the 30th district. |
2013–2023.tif.png) West Hollywood, Burbank, Glendale, Northeastern Los Angeles suburbs, as well as parts of Central Los Angeles. |
 Judy Chu (Monterey Park) |
Democratic | January 3, 2023 – present |
118th 119th |
Redistricted from the 27th district and re-elected in 2022. Re-elected in 2024. |
2023–present:_(new_version).svg.png) Parts of Los Angeles and San Bernardino counties and covers much of the San Gabriel Foothills |
Election results
|
1952 • 1954 • 1956 • 1958 • 1960 • 1962 • 1964 • 1966 • 1968 • 1970 • 1972 • 1974 • 1976 • 1978 • 1980 • 1982 • 1984 • 1986 • 1988 • 1990 • 1992 • 1994 • 1996 • 1998 • 2000 • 2002 • 2004 • 2006 • 2008 • 2012 • 2014 • 2016 • 2018 • 2020 • 2022 |
1952
| Party | Candidate | Votes | % | ||
|---|---|---|---|---|---|
| Republican | James B. Utt | 106,972 | 63.0 | ||
| Democratic | Lionel Van Deerlin | 62,779 | 37.0 | ||
| Total votes | 169,751 | 100.0 | |||
| Republican win (new seat) | |||||
1954
| Party | Candidate | Votes | % | |
|---|---|---|---|---|
| Republican | James B. Utt (Incumbent) | 95,680 | 66.2 | |
| Democratic | Harriet Enderle | 48,785 | 33.8 | |
| Total votes | 144,465 | 100.0 | ||
| Republican hold | ||||
1956
| Party | Candidate | Votes | % | |
|---|---|---|---|---|
| Republican | James B. Utt (Incumbent) | 159,456 | 64.5 | |
| Democratic | Gordon T. Shepard | 87,691 | 35.5 | |
| Total votes | 247,147 | 100.0 | ||
| Republican hold | ||||
1958
| Party | Candidate | Votes | % | |
|---|---|---|---|---|
| Republican | James B. Utt (Incumbent) | 152,855 | 58.2 | |
| Democratic | T. R. Boyett | 109,794 | 41.8 | |
| Total votes | 262,649 | 100.0 | ||
| Republican hold | ||||
1960
| Party | Candidate | Votes | % | |
|---|---|---|---|---|
| Republican | James B. Utt (Incumbent) | 241,765 | 60.9 | |
| Democratic | Max E. Woods | 155,221 | 39.1 | |
| Total votes | 396,986 | 100.0 | ||
| Republican hold | ||||
1962
| Party | Candidate | Votes | % | |
|---|---|---|---|---|
| Republican | Alphonzo E. Bell, Jr. (Incumbent) | 162,233 | 64.0 | |
| Democratic | Jerry Pacht | 91,305 | 36.0 | |
| Total votes | 253,538 | 100.0 | ||
| Republican hold | ||||
1964
| Party | Candidate | Votes | % | |
|---|---|---|---|---|
| Republican | Alphonzo E. Bell, Jr. (Incumbent) | 205,473 | 65.6 | |
| Democratic | Gerald A. Gottlieb | 107,852 | 34.4 | |
| Total votes | 313,325 | 100.0 | ||
| Republican hold | ||||
1966
| Party | Candidate | Votes | % | |
|---|---|---|---|---|
| Republican | Alphonzo E. Bell, Jr. (Incumbent) | 211,404 | 72.3 | |
| Democratic | Lawrence "Lorry" Sherman | 81,007 | 27.7 | |
| Total votes | 292,411 | 100.0 | ||
| Republican hold | ||||
1968
| Party | Candidate | Votes | % | |
|---|---|---|---|---|
| Republican | Alphonzo E. Bell, Jr. (Incumbent) | 168,208 | 71.2 | |
| Democratic | John McKee Pratt | 63,414 | 26.9 | |
| Peace and Freedom | Sherman Pearl | 4,503 | 1.9 | |
| Total votes | 236,125 | 100.0 | ||
| Republican hold | ||||
1970
| Party | Candidate | Votes | % | |
|---|---|---|---|---|
| Republican | Alphonzo E. Bell, Jr. (Incumbent) | 154,691 | 69.3 | |
| Democratic | Don McLaughlin | 57,882 | 25.9 | |
| American Independent | Derek A. Gordon | 5,759 | 2.6 | |
| Peace and Freedom | Jane E. Gordon | 4,971 | 2.2 | |
| Total votes | 223,303 | 100.0 | ||
| Republican hold | ||||
1972
| Party | Candidate | Votes | % | |
|---|---|---|---|---|
| Republican | Alphonzo E. Bell, Jr. (Incumbent) | 142,102 | 60.7 | |
| Democratic | Michael Shapiro | 87,783 | 37.5 | |
| Peace and Freedom | Jack Hampton | 4,184 | 1.8 | |
| Total votes | 234,069 | 100.0 | ||
| Republican hold | ||||
1974
| Party | Candidate | Votes | % | |
|---|---|---|---|---|
| Democratic | Yvonne Brathwaite Burke (Incumbent) | 86,743 | 80.1 | |
| Republican | Tom Neddy | 21,308 | 19.9 | |
| Total votes | 108,051 | 100.0 | ||
| Democratic hold | ||||
1976
| Party | Candidate | Votes | % | |
|---|---|---|---|---|
| Democratic | Yvonne Brathwaite Burke (Incumbent) | 114,612 | 80.2 | |
| Republican | Edward S. Skinner | 28,303 | 19.8 | |
| Total votes | 142,915 | 100.0 | ||
| Democratic hold | ||||
1978
| Party | Candidate | Votes | % | |
|---|---|---|---|---|
| Democratic | Julian C. Dixon | 97,592 | 100.0 | |
| Democratic hold | ||||
1980
| Party | Candidate | Votes | % | |
|---|---|---|---|---|
| Democratic | Julian C. Dixon (Incumbent) | 108,725 | 79.2 | |
| Republican | Robert Reid | 23,179 | 16.9 | |
| Libertarian | Ernst F. Ghermann | 5,400 | 3.9 | |
| Total votes | 137,304 | 100.0 | ||
| Democratic hold | ||||
1982
| Party | Candidate | Votes | % | |
|---|---|---|---|---|
| Democratic | Julian C. Dixon (Incumbent) | 103,469 | 78.9 | |
| Republican | David Goerz | 24,473 | 18.7 | |
| Libertarian | David W. Meleney | 3,210 | 2.4 | |
| Total votes | 131,152 | 100.0 | ||
| Democratic hold | ||||
1984
| Party | Candidate | Votes | % | |
|---|---|---|---|---|
| Democratic | Julian C. Dixon (Incumbent) | 113,076 | 75.6 | |
| Republican | Beatrice M. Jett | 33,511 | 22.4 | |
| Libertarian | Don Swemgimurti Federick | 2,930 | 2.0 | |
| Total votes | 149,517 | 100.0 | ||
| Democratic hold | ||||
1986
| Party | Candidate | Votes | % | |
|---|---|---|---|---|
| Democratic | Julian C. Dixon (Incumbent) | 92,635 | 76.4 | |
| Republican | George Zaldivar Adams | 25,858 | 21.3 | |
| Libertarian | Howard Johnson | 2,837 | 2.3 | |
| Total votes | 121,330 | 100.0 | ||
| Democratic hold | ||||
1988
| Party | Candidate | Votes | % | |
|---|---|---|---|---|
| Democratic | Julian C. Dixon (Incumbent) | 109,801 | 76.2 | |
| Republican | George Zaldivar Adams | 28,645 | 19.8 | |
| Libertarian | Howard Johnson | 3,080 | 2.1 | |
| Peace and Freedom | Salomea Honigsfeld | 2,811 | 1.9 | |
| Total votes | 144,337 | 100.0 | ||
| Democratic hold | ||||
1990
| Party | Candidate | Votes | % | |
|---|---|---|---|---|
| Democratic | Julian C. Dixon (Incumbent) | 69,482 | 72.8 | |
| Republican | George Zaldivar Adams | 21,245 | 22.2 | |
| Peace and Freedom | William R. Williams II | 2,723 | 2.8 | |
| Libertarian | Robert G. "Bob" Weber Jr. | 2,150 | 2.2 | |
| Total votes | 95,600 | 100.0 | ||
| Democratic hold | ||||
1992
| Party | Candidate | Votes | % | |
|---|---|---|---|---|
| Republican | David Dreier (Incumbent) | 122,353 | 58.4 | |
| Democratic | Al Wachtel | 76,525 | 36.6 | |
| Green | Walt Contreras Sheasby | 6,233 | 3.0 | |
| Libertarian | Thomas J. Dominy | 4,271 | 2.0 | |
| Total votes | 209,382 | 100.0 | ||
| Republican hold | ||||
1994
| Party | Candidate | Votes | % | |
|---|---|---|---|---|
| Republican | David Dreier (Incumbent) | 110,179 | 67.1 | |
| Democratic | Tommy Randle | 50,022 | 30.4 | |
| Libertarian | Jorj Clayton Baker | 4,069 | 2.5 | |
| Independent | Hatch (write-in) | 7 | 0.0 | |
| Total votes | 164,277 | 100.0 | ||
| Republican hold | ||||
1996
| Party | Candidate | Votes | % | |
|---|---|---|---|---|
| Republican | David Dreier (Incumbent) | 113,389 | 60.7 | |
| Democratic | David Levering | 69,037 | 37.0 | |
| Libertarian | Ken Saurenman | 4,459 | 2.3 | |
| Total votes | 186,885 | 100.0 | ||
| Republican hold | ||||
1998
| Party | Candidate | Votes | % | |
|---|---|---|---|---|
| Republican | David Dreier (Incumbent) | 90,607 | 57.7 | |
| Democratic | Janice M. Nelson | 61,721 | 39.3 | |
| Libertarian | Jerry R. Douglas | 2,099 | 1.3 | |
| Green | Walt Contreras Sheasby | 1,954 | 1.2 | |
| Natural Law | M. Lawrence Allison | 819 | 0.5 | |
| Total votes | 157,200 | 100.0 | ||
| Republican hold | ||||
2000
| Party | Candidate | Votes | % | |
|---|---|---|---|---|
| Republican | David Dreier (Incumbent) | 116,557 | 56.9 | |
| Democratic | Janice M. Nelson | 81,804 | 39.9 | |
| Libertarian | Randall G. Weissbuch | 2,823 | 1.3 | |
| Natural Law | Lawrence Allison | 2,083 | 1.0 | |
| American Independent | Joe "Jay" Haytas | 1,932 | 0.9 | |
| Total votes | 205,199 | 100.0 | ||
| Republican hold | ||||
2002
| Party | Candidate | Votes | % | |
|---|---|---|---|---|
| Democratic | Howard Berman (Incumbent) | 73,771 | 71.4 | |
| Republican | David R. Hernandez, Jr. | 23,926 | 23.2 | |
| Libertarian | Kelley L. Ross | 5,629 | 5.4 | |
| Total votes | 113,326 | 100.0 | ||
| Democratic hold | ||||
2004
| Party | Candidate | Votes | % | |
|---|---|---|---|---|
| Democratic | Howard Berman (Incumbent) | 115,303 | 71.0 | |
| Republican | David Hernandez | 37,868 | 23.3 | |
| Libertarian | Kelley L. Ross | 9,339 | 5.7 | |
| Total votes | 162,410 | 100.0 | ||
| Democratic hold | ||||
2006
| Party | Candidate | Votes | % | |
|---|---|---|---|---|
| Democratic | Howard Berman (Incumbent) | 79,866 | 74.0 | |
| Republican | Stanley Kimmel Kesselman | 20,629 | 19.1 | |
| Green | Byron De Lear | 3,868 | 3.5 | |
| Libertarian | Kelley L. Ross | 3,679 | 3.4 | |
| Total votes | 108,042 | 100.0 | ||
| Democratic hold | ||||
2008
| Party | Candidate | Votes | % | |
|---|---|---|---|---|
| Democratic | Howard Berman (Incumbent) | 137,471 | 100.0 | |
| Democratic hold | ||||
2010
| Party | Candidate | Votes | % | |
|---|---|---|---|---|
| Democratic | Howard Berman (Incumbent) | 88,385 | 69.6 | |
| Republican | Merlin Froyd | 28,493 | 22.4 | |
| Libertarian | Carlos A. Rodriguez | 10,229 | 8.0 | |
| Total votes | 127,107 | 100.0 | ||
| Democratic hold | ||||
2012
| Party | Candidate | Votes | % | |
|---|---|---|---|---|
| Democratic | Adam Schiff (Incumbent) | 188,703 | 76.5 | |
| Republican | Phil Jennerjahn | 58,008 | 23.5 | |
| Total votes | 246,711 | 100.0 | ||
| Democratic hold | ||||
2014
| Party | Candidate | Votes | % | |
|---|---|---|---|---|
| Democratic | Adam Schiff (Incumbent) | 91,996 | 76.5 | |
| No party preference | Steve Stokes | 28,268 | 23.5 | |
| Total votes | 120,264 | 100.0 | ||
| Democratic hold | ||||
2016
| Party | Candidate | Votes | % | |
|---|---|---|---|---|
| Democratic | Adam Schiff (Incumbent) | 210,883 | 78.0 | |
| Republican | Lenore Solis | 59,526 | 22.0 | |
| Total votes | 270,409 | 100.0 | ||
| Democratic hold | ||||
2018
| Party | Candidate | Votes | % | |
|---|---|---|---|---|
| Democratic | Adam Schiff (Incumbent) | 196,662 | 78.4 | |
| Republican | Johnny J. Nalbandian | 54,272 | 21.6 | |
| Total votes | 250,934 | 100.0 | ||
| Democratic hold | ||||
2020
| Party | Candidate | Votes | % | |
|---|---|---|---|---|
| Democratic | Adam Schiff (Incumbent) | 244,471 | 72.7 | |
| Republican | Eric Early | 91,928 | 27.3 | |
| Total votes | 336,399 | 100.0 | ||
| Democratic hold | ||||
2022
| Party | Candidate | Votes | % | |
|---|---|---|---|---|
| Democratic | Judy Chu (Incumbent) | 150,062 | 66.2 | |
| Republican | Wes Hallman | 76,495 | 33.8 | |
| Total votes | 226,557 | 100.0 | ||
| Democratic hold | ||||
2024
| Party | Candidate | Votes | % | |
|---|---|---|---|---|
| Democratic | Judy Chu (Incumbent) | 204,489 | 64.9 | |
| Republican | April Verlato | 110,455 | 35.1 | |
| Total votes | 314,944 | 100.0 | ||
| Democratic hold | ||||
See also
References
- ^ | distribution = 100% urban 0% rural US Census
- ^ "2025 Cook PVI℠: District Map and List (119th Congress)". Cook Political Report. Retrieved April 5, 2025.
- ^ "California's Political Geography". Public Policy Institute of California.
- ^ https://davesredistricting.org/maps#viewmap::fc9d2d06-7c7f-451c-92cb-122127a79c29
- ^ "Supplement to Statement of Vote" (PDF). November 8, 2022. Archived (PDF) from the original on January 8, 2025. Retrieved January 21, 2025.
- ^ "Supplement to Statement of Vote" (PDF). November 5, 2024. Archived (PDF) from the original on April 9, 2025. Retrieved April 5, 2025.
- ^ "California FIPS Codes". National Weather Service. Retrieved March 11, 2025.
- ^ "1952 election results" (PDF).
- ^ "1954 election results" (PDF).
- ^ "1956 election results" (PDF).
- ^ "1958 election results" (PDF).
- ^ "1960 election results" (PDF).
- ^ "1962 election results" (PDF).
- ^ "1964 election results" (PDF).
- ^ "1966 election results" (PDF).
- ^ "1968 election results" (PDF).
- ^ "1970 election results" (PDF).
- ^ "1972 election results" (PDF).
- ^ "1974 election results" (PDF).
- ^ "1976 election results" (PDF).
- ^ "1978 election results" (PDF).
- ^ "1980 election results" (PDF).
- ^ "1982 election results" (PDF).
- ^ "1984 election results" (PDF).
- ^ "1986 election results" (PDF).
- ^ "1988 election results" (PDF).
- ^ "1990 election results" (PDF).
- ^ "1992 election results" (PDF).
- ^ "1994 election results" (PDF).
- ^ "1996 election results" (PDF).
- ^ "1998 election results" (PDF).
- ^ "2000 election results" (PDF).
- ^ 2002 election results
- ^ 2004 election results
- ^ 2006 election results
- ^ 2008 election results
- ^ 2010 election results
- ^ 2012 election results
- ^ 2014 election results
- ^ 2016 election results
- ^ 2018 election results