California's 42nd congressional district
| California's 42nd congressional district | |
|---|---|
Interactive map of district boundaries since January 3, 2023 | |
| Representative | |
| Population (2023) | 711,011[1] |
| Median household income | $78,377[1] |
| Ethnicity |
|
| Cook PVI | D+18[2] |
.svg.png)
California's 42nd congressional district is a U.S. congressional district in California. The district is currently represented by Democrat Robert Garcia.
The 42nd district is located entirely within Los Angeles County, and is centered around Long Beach and its surrounding suburbs.
Recent election results from statewide races
| Year | Office | Results[3][4][5] |
|---|---|---|
| 2008 | President | Obama 69% - 30% |
| 2010 | Governor | Brown 62% - 32% |
| Lt. Governor | Newsom 57% - 32% | |
| Secretary of State | Bowen 61% - 29% | |
| Attorney General | Harris 53% - 39% | |
| Treasurer | Lockyer 64% - 28% | |
| Controller | Chiang 61% - 29% | |
| 2012 | President | Obama 72% - 28% |
| 2014 | Governor | Brown 65% - 35% |
| 2016 | President | Clinton 72% - 22% |
| 2018 | Governor | Newsom 72% - 28% |
| Attorney General | Becerra 74% - 26% | |
| 2020 | President | Biden 72% - 26% |
| 2022 | Senate (Reg.) | Padilla 69% - 31% |
| Governor | Newsom 67% - 33% | |
| Lt. Governor | Kounalakis 67% - 33% | |
| Secretary of State | Weber 67% - 33% | |
| Attorney General | Bonta 67% - 33% | |
| Treasurer | Ma 65% - 35% | |
| Controller | Cohen 63% - 37% | |
| 2024 | President | Harris 64% - 32% |
| Senate (Reg.) | Schiff 65% - 35% |
Composition
| FIPS County Code[6] | County | Seat | Population |
|---|---|---|---|
| 37 | Los Angeles | Los Angeles | 9,663,345 |
Under the 2020 redistricting, California's 42nd congressional district has been geographically shifted to the South Bay region of Los Angeles County. It also takes in two of the Channel Islands: Santa Catalina and San Clemente, in the Southern California Bight. The district also includes the cities of Huntington Park, Bell, Bell Gardens, Maywood, Signal Hill, Vernon, Cudahy, Commerce, south Long Beach, east side Lakewood, most of Downey and Bellflower; and the census-designated places Florence-Graham and Walnut Park.
Los Angeles County is split between this district, the 34th district, the 37th district, the 38th district, the 45th district, the 44th district, the 47th district, and the 43rd district. The 42nd, 34th and 38th are partitioned by S Gerhart Ave, Simmons Ave, Dewar Ave, W Beverly Blvd, Repetto Ave, Allston St, S Concourse Ave, Ferguson Dr, Simmons Ave/S Gerhart Ave, Highway 72, Goodrich Blvd, Telegraph Rd, S Marianna Ave, Noakes St, S Bonnie Beach Pl, Union Pacific Ave, S Indiana St, Union Pacific Railroad, Holabird Ave, S Grande Vista Ave, AT & SF Railway, Harriet St, and E 25th St.
The 42nd, 37th, and 43rd are partitioned by S Alameda St, E Slauson Ave, S Central Ave, Firestone Blvd-E 90 St, S Central Ave, E 103rd St, Success Ave, E 92nd St, E 91st, Croesus Ave, and E 97th St.
The 42nd, 38th, 45th, and 47th are partitioned by Yates Ave, E Acco St, 6866 E Washington Blvd-2808 Vail Ave, S 14th St, AT & SF Railway, Church Rd, Telegraph Rd, Rio Hondo River, Veterans Memorial Park, Suva St, Guatemala Ave, Shady Oak Dr, Coolgrove Dr, Gallatin Rd, Samoline Ave, Paramount Blvd, Arrington Ave, Suva St, Charloma Dr, Lubet St, Highway 5, San Gabriel River, Palo Verde Ave, South St, Del Amo Blvd, Pioneer Blvd, Coyote Creek, Centralia Creek, Hawaiian Ave, Verne Ave, Bloomfield Park, Highway 605, 226th St, Dorado Cir, Cortner Ave, E Woodson St, Bloomfield Ave, Lilly Ave, Marna Ave, Los Alamos Channel, and the San Gabriel Bike Path.
The 42nd and 44th are partitioned by S Alameda St, Southern Pacific Railroad, Ardmore Ave, Long Beach Blvd, Pacific Blvd, Cudahy St, 2622 Cudahy St-3211 Santa Ana St, Santa Ana St, Salt Lake Ave, Patata St, 7038 Dinwiddie St-10112 Karmont Ave, Imperial Highway, Old River School Rd, Union Pacific Railroad, Gardendale St, Century Blvd, Highway 19. Laurel St, Clark Ave, Beach St, Bellflower Blvd, E Carson St, Woodruff Ave, Gonda Ave, E Wardlow Rd, N Los Coyotes Diagonal, McNab Ave, E Spring St, E Harvey Way, Faculty Ave, E Carson St, Norse Way, Lakewood Golf Course, Cover St, E 36th St, Cherry Ave, Atlantic Ave, E Willow St, Long Beach Blvd, Highway 1, Oregon Ave, W Anaheim St, Los Angeles River, Canal Ave, W 19th St, Santa Fe Ave, Seabright Ave, W 25th St, W Willow St, Middle Rd-East Rd, 2300 E Pacific Coast Highway-W Anaheim St, E Anaheim St-Cerritos Channel, Piers S Ave, Highway 47, and Navy Mole Rd.
Cities and CDPs with 10,000 or more people
- Long Beach – 466,742
- Downey – 114,355
- Lakewood – 82,496
- Bellflower – 79,190
- Florence-Graham – 61,983
- Huntington Park – 52,633
- Bell Gardens – 39,501
- Bell – 33,559
- Maywood – 25,138
- Cudahy – 22,811
- Walnut Park – 15,214
- Commerce – 12,378
- Signal Hill – 11,848
List of members representing the district
| Member | Party | Dates | Cong ress(es) |
Electoral history | Counties |
|---|---|---|---|---|---|
| District created January 3, 1973 | |||||
 Clair Burgener (Rancho Santa Fe) |
Republican | January 3, 1973 – January 3, 1975 |
93rd | Elected in 1972. Redistricted to the 43rd district. |
1973–1975 Southern Coastal Orange, Coastal San Diego outside the city |
 Lionel Van Deerlin (Chula Vista) |
Democratic | January 3, 1975 – January 3, 1981 |
94th 95th 96th |
Redistricted from the 41st district and re-elected in 1974. Re-elected in 1976. Re-elected in 1978. Lost re-election. |
1975–1983 San Diego (San Diego City southern half) |
 Duncan Hunter (Coronado) |
Republican | January 3, 1981 – January 3, 1983 |
97th | Elected in 1980. Redistricted to the 45th district. | |
 Dan Lungren (Long Beach) |
Republican | January 3, 1983 – January 3, 1989 |
98th 99th 100th |
Redistricted from the 34th district and re-elected in 1982. Re-elected in 1984. Re-elected in 1986. Resigned when appointed California State Treasurer. |
1983–1993 Los Angeles (Palos Verdes), Northwestern Orange |
 Dana Rohrabacher (Long Beach) |
Republican | January 3, 1989 – January 3, 1993 |
101st 102nd |
Elected in 1988. Re-elected in 1990. Redistricted to the 45th district. | |
 George Brown Jr. (San Bernardino) |
Democratic | January 3, 1993 – July 15, 1999 |
103rd 104th 105th 106th |
Redistricted from the 36th district and re-elected in 1992. Re-elected in 1994. Re-elected in 1996. Re-elected in 1998. Died. |
1993–2003 San Bernardino (Inland Empire) |
| Vacant | July 15, 1999 – November 16, 1999 |
106th | |||
 Joe Baca (Fontana) |
Democratic | November 16, 1999 – January 3, 2003 |
106th 107th |
Elected to finish Brown's term. Re-elected in 2000. Redistricted to the 43rd district. | |
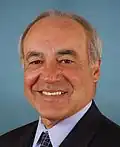
 Gary Miller (Diamond Bar) |
Republican | January 3, 2003 – January 3, 2013 |
108th 109th 110th 111th 112th |
Redistricted from the 41st district and re-elected in 2002. Re-elected in 2004. Re-elected in 2006. Re-elected in 2008. Re-elected in 2010. Redistricted to the 31st district. |
2003–2013 Southeastern Los Angeles, Northeastern Orange, Southwestern San Bernardino |
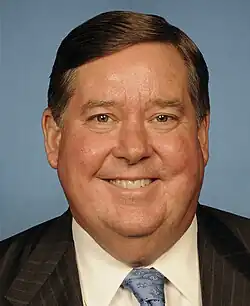 Ken Calvert (Corona) |
Republican | January 3, 2013 – January 3, 2023 |
113th 114th 115th 116th 117th |
Redistricted from the 44th district and re-elected in 2012. Re-elected in 2014. Re-elected in 2016. Re-elected in 2018. Re-elected in 2020. Redistricted to the 41st district. |
2013–2023.tif.png) Inland Empire (Corona and Murrieta) |
 Robert Garcia (Long Beach) |
Democratic | January 3, 2023 – present |
118th 119th |
Elected in 2022. Re-elected in 2024. |
2023–present_(new_version).svg.png) Southern Los Angeles |
Election results
|
1972 • 1974 • 1976 • 1978 • 1980 • 1982 • 1984 • 1986 • 1988 • 1990 • 1992 • 1994 • 1996 • 1998 • 1999 (Special) • 2000 • 2002 • 2004 • 2006 • 2008 • 2010 • 2012 • 2014 • 2016 • 2018 • 2020 • 2022 • 2024 |
1972
| Party | Candidate | Votes | % | ||
|---|---|---|---|---|---|
| Republican | Clair Burgener (Incumbent) | 155,965 | 67.4 | ||
| Democratic | Bob Lowe | 67,477 | 29.2 | ||
| American Independent | Armin R. Moths | 7,812 | 3.4 | ||
| Total votes | 231,254 | 100.0 | |||
| Republican win (new seat) | |||||
1974
| Party | Candidate | Votes | % | |
|---|---|---|---|---|
| Democratic | Lionel Van Deerlin (Incumbent) | 69,746 | 69.9 | |
| Republican | Wes Marden | 30,058 | 30.1 | |
| Total votes | 99,804 | 100.0 | ||
| Democratic hold | ||||
1976
| Party | Candidate | Votes | % | |
|---|---|---|---|---|
| Democratic | Lionel Van Deerlin (Incumbent) | 103,062 | 76.0 | |
| Republican | Wes Marden | 32,565 | 24.0 | |
| Total votes | 135,627 | 100.0 | ||
| Democratic hold | ||||
1978
| Party | Candidate | Votes | % | |
|---|---|---|---|---|
| Democratic | Lionel Van Deerlin (Incumbent) | 85,126 | 73.7 | |
| Republican | Lawrence C. Mattera | 30,319 | 26.3 | |
| Total votes | 115,445 | 100.0 | ||
| Democratic hold | ||||
1980
| Party | Candidate | Votes | % | |||
|---|---|---|---|---|---|---|
| Republican | Duncan Hunter | 79,713 | 53.3 | |||
| Democratic | Lionel Van Deerlin (Incumbent) | 69,936 | 46.7 | |||
| Total votes | 149,649 | 100.0 | ||||
| Republican gain from Democratic | ||||||
1982
| Party | Candidate | Votes | % | |
|---|---|---|---|---|
| Republican | Dan Lungren (Incumbent) | 142,845 | 69.0 | |
| Democratic | James P. Spellman | 58,690 | 28.3 | |
| Peace and Freedom | John S. Donohue | 5,514 | 2.7 | |
| Total votes | 207,049 | 100.0 | ||
| Republican hold | ||||
1984
| Party | Candidate | Votes | % | |
|---|---|---|---|---|
| Republican | Dan Lungren (Incumbent) | 177,783 | 73.0 | |
| Democratic | Mary Lou Brophy | 60,025 | 24.6 | |
| Peace and Freedom | John S. Donohue | 5,811 | 2.4 | |
| Total votes | 243,619 | 100.0 | ||
| Republican hold | ||||
1986
| Party | Candidate | Votes | % | |
|---|---|---|---|---|
| Republican | Dan Lungren (Incumbent) | 140,364 | 72.8 | |
| Democratic | Michael P. Blackburn | 47,586 | 24.7 | |
| Peace and Freedom | Kate McClatchy | 4,761 | 2.5 | |
| Total votes | 192,711 | 100.0 | ||
| Republican hold | ||||
1988
| Party | Candidate | Votes | % | |
|---|---|---|---|---|
| Republican | Dana Rohrabacher | 153,280 | 64.2 | |
| Democratic | Guy C. Kimbrough | 78,778 | 33.0 | |
| Libertarian | Richard D. Rose | 6,563 | 2.8 | |
| Total votes | 238,621 | 100.0 | ||
| Republican hold | ||||
1990
| Party | Candidate | Votes | % | |
|---|---|---|---|---|
| Republican | Dana Rohrabacher (Incumbent) | 109,353 | 59.3 | |
| Democratic | Guy C. Kimbrough | 67,189 | 36.5 | |
| Libertarian | Richard Gibb Martin | 7,744 | 4.2 | |
| Total votes | 184,286 | 100.0 | ||
| Republican hold | ||||
1992
| Party | Candidate | Votes | % | |
|---|---|---|---|---|
| Democratic | George Brown, Jr. (Incumbent) | 79,780 | 50.7 | |
| Republican | Dick Rutan | 69,251 | 44.0 | |
| Libertarian | Fritz R. Ward | 8,424 | 5.3 | |
| Total votes | 157,455 | 100.0 | ||
| Democratic hold | ||||
1994
| Party | Candidate | Votes | % | |
|---|---|---|---|---|
| Democratic | George Brown, Jr. (Incumbent) | 58,888 | 51.1 | |
| Republican | Rob Guzman | 56,259 | 48.9 | |
| Independent | LaBine (write-in) | 44 | 0.0 | |
| Independent | Sanchez (write-in) | 14 | 0.0 | |
| Total votes | 115,205 | 100.0 | ||
| Democratic hold | ||||
1996
| Party | Candidate | Votes | % | |
|---|---|---|---|---|
| Democratic | George Brown, Jr. (Incumbent) | 52,166 | 50.5 | |
| Republican | Linda Wilde | 51,170 | 49.5 | |
| Total votes | 103,336 | 100.0 | ||
| Democratic hold | ||||
1998
| Party | Candidate | Votes | % | |
|---|---|---|---|---|
| Democratic | George Brown, Jr. (Incumbent) | 62,207 | 55.3 | |
| Republican | Elia Pirozzi | 45,328 | 40.3 | |
| American Independent | Hale McGee | 3,086 | 2.7 | |
| Libertarian | David Lynn Hollist | 1,899 | 1.7 | |
| Total votes | 112,520 | 100.0 | ||
| Democratic hold | ||||
1999 (special)
| Party | Candidate | Votes | % | |
|---|---|---|---|---|
| Democratic | Joe Baca | 23,690 | 50.5 | |
| Republican | Elia Pirozzi | 21,018 | 44.9 | |
| Reform | Rick Simon | 1,198 | 2.6 | |
| Libertarian | John S. Ballard | 956 | 2.0 | |
| Total votes | 46,862 | 100.0 | ||
| Turnout | 19.4 | |||
| Democratic hold | ||||
2000
| Party | Candidate | Votes | % | |
|---|---|---|---|---|
| Democratic | Joe Baca (Incumbent) | 90,585 | 59.8 | |
| Republican | Eli Pirozzi | 53,239 | 35.2 | |
| Libertarian | John "Scott" Ballard | 4,059 | 2.6 | |
| Natural Law | Gwyn Hartley | 3,694 | 2.4 | |
| Total votes | 151,577 | 100.0 | ||
| Democratic hold | ||||
2002
| Party | Candidate | Votes | % | |
|---|---|---|---|---|
| Republican | Gary Miller (Incumbent) | 98,476 | 67.8 | |
| Democratic | Richard Waldron | 42,090 | 29.0 | |
| Libertarian | Donald Yee | 4,680 | 3.2 | |
| Total votes | 145,186 | 100.0 | ||
| Republican hold | ||||
2004
| Party | Candidate | Votes | % | |
|---|---|---|---|---|
| Republican | Gary Miller (Incumbent) | 167,632 | 68.2 | |
| Democratic | Lewis Myers | 78,393 | 31.8 | |
| Total votes | 246,025 | 100.0 | ||
| Republican hold | ||||
2006
| Party | Candidate | Votes | % | |
|---|---|---|---|---|
| Republican | Gary Miller (Incumbent) | 129,720 | 100.0 | |
| Republican hold | ||||
2008
| Party | Candidate | Votes | % | |
|---|---|---|---|---|
| Republican | Gary Miller (Incumbent) | 158,404 | 60.2 | |
| Democratic | Ed Chau | 104,909 | 39.8 | |
| Total votes | 263,313 | 100.0 | ||
| Republican hold | ||||
2010
| Party | Candidate | Votes | % | |
|---|---|---|---|---|
| Republican | Gary Miller (Incumbent) | 127,161 | 62.3 | |
| Democratic | Michael Williamson | 65,122 | 31.8 | |
| Libertarian | Mark Lambert | 12,115 | 5.9 | |
| Total votes | 204,398 | 100.0 | ||
| Republican hold | ||||
2012
| Party | Candidate | Votes | % | |
|---|---|---|---|---|
| Republican | Ken Calvert (Incumbent) | 130,245 | 60.6 | |
| Democratic | Michael Williamson | 84,702 | 39.4 | |
| Total votes | 214,947 | 100.0 | ||
| Republican hold | ||||
2014
| Party | Candidate | Votes | % | |
|---|---|---|---|---|
| Republican | Ken Calvert (Incumbent) | 74,540 | 65.7 | |
| Democratic | Tim Sheridan | 38,850 | 34.3 | |
| Total votes | 113,390 | 100.0 | ||
| Republican hold | ||||
2016
| Party | Candidate | Votes | % | |
|---|---|---|---|---|
| Republican | Ken Calvert (Incumbent) | 149,547 | 58.8 | |
| Democratic | Tim Sheridan | 104,689 | 41.2 | |
| Total votes | 254,236 | 100.0 | ||
| Republican hold | ||||
2018
| Party | Candidate | Votes | % | |
|---|---|---|---|---|
| Republican | Ken Calvert (Incumbent) | 131,040 | 56.5 | |
| Democratic | Julia C. Peacock | 100,892 | 43.5 | |
| Total votes | 231,932 | 100.0 | ||
| Republican hold | ||||
2020
| Party | Candidate | Votes | % | |
|---|---|---|---|---|
| Republican | Ken Calvert (Incumbent) | 210,274 | 57.1 | |
| Democratic | William "Liam" O'Mara | 157,773 | 42.9 | |
| Total votes | 368,047 | 100.0 | ||
| Republican hold | ||||
2022
| Party | Candidate | Votes | % | |
|---|---|---|---|---|
| Democratic | Robert Garcia | 99,217 | 68.4 | |
| Republican | John Briscoe | 45,903 | 31.6 | |
| Total votes | 145,120 | 100.0 | ||
| Democratic hold | ||||
2024
| Primary election | ||||
|---|---|---|---|---|
| Party | Candidate | Votes | % | |
| Democratic | Robert Garcia (incumbent) | 49,891 | 52.1 | |
| Republican | John Briscoe | 30,599 | 31.9 | |
| Democratic | Nicole López | 8,758 | 9.1 | |
| Democratic | Joaquin Beltran | 6,532 | 6.8 | |
| Total votes | 95,780 | 100.0 | ||
| General election | ||||
| Democratic | Robert Garcia (incumbent) | 159,153 | 68.1 | |
| Republican | John Briscoe | 74,410 | 31.9 | |
| Total votes | 233,563 | 100.0 | ||
| Democratic hold | ||||
Historical district boundaries
From 2003 to 2013, the district covered parts of Los Angeles, Orange, and San Bernardino counties in Southern California.
See also
References
- ^ a b "Congressional District 42 (118th Congress), California". census.gov. U.S. Census Bureau. Retrieved September 21, 2024.
- ^ "2025 Cook PVI℠: District Map and List (119th Congress)". Cook Political Report. Retrieved April 5, 2025.
- ^ https://davesredistricting.org/maps#viewmap::fc9d2d06-7c7f-451c-92cb-122127a79c29
- ^ "Supplement to Statement of Vote" (PDF). November 8, 2022. Archived (PDF) from the original on January 8, 2025. Retrieved January 21, 2025.
- ^ "Supplement to Statement of Vote" (PDF). November 5, 2024. Archived (PDF) from the original on April 9, 2025. Retrieved April 5, 2025.
- ^ "California FIPS Codes". National Weather Service. Retrieved March 11, 2025.
- ^ 1972 election results
- ^ 1974 election results
- ^ 1976 election results
- ^ 1978 election results
- ^ 1980 election results
- ^ 1982 election results
- ^ 1984 election results
- ^ 1986 election results
- ^ 1988 election results
- ^ 1990 election results
- ^ 1992 election results
- ^ 1994 election results
- ^ 1996 election results
- ^ 1998 election results
- ^ 1999 special election results
- ^ 1999 special election results
- ^ 2000 election results
- ^ 2002 election results
- ^ 2004 election results
- ^ 2006 election results
- ^ 2008 election results
- ^ 2010 election results
- ^ 2012 election results
- ^ 2014 election results
- ^ 2016 election results
- ^ 2018 election results
- ^ 2020 election results
- ^ Cite error: The named reference
primaryresultswas invoked but never defined (see the help page). - ^ Cite error: The named reference
genr1was invoked but never defined (see the help page).