Thunder Bay District
Thunder Bay District | |
|---|---|
 Location of Thunder Bay District in Ontario | |
| Coordinates: 50°N 088°W / 50°N 88°W | |
| Country | Canada |
| Province | Ontario |
| Region | Northwestern Ontario |
| Created | 1871 |
| Government | |
| • MPs | Eric Melillo (Conservative) Marcus Powlowski (Liberal)[1] Patty Hajdu (Liberal) |
| • MPPs | Bill Rosenberg (PC) Kevin Holland (PC) Lise Vaugeois (NDP) Sol Mamakwa (NDP) |
| Area | |
| • Land | 102,895.48 km2 (39,728.17 sq mi) |
| Population (2021)[2] | |
• Total | 146,862 |
| • Density | 1.4/km2 (4/sq mi) |
| Time zones | |
| East of 90° west | UTC-05:00 (Eastern) |
| • Summer (DST) | UTC-04:00 (EDT) |
| West of 90° west | UTC-06:00 (Central) |
| • Summer (DST) | UTC-05:00 (CDT) |
| Postal code span | P0S, P0T, P7A to P7G, P7J to P7L |
| Area code | 807 |
| Largest communities [3] | Thunder Bay (109,140) Oliver Paipoonge (5,757) Greenstone (4,906) |

Thunder Bay District is a district and census division in Northwestern Ontario in the Canadian province of Ontario. The district seat is Thunder Bay.
Most of the district (93.5%) is unincorporated and part of the Unorganized Thunder Bay District.
History
Thunder Bay District was created in 1871 by provincial statute from the western half of Algoma District, named after a large bay on the north shore of Lake Superior. Its northern and western boundaries were uncertain until Ontario's right to Northwestern Ontario was determined by the Judicial Committee of the Privy Council.[4] Until about 1902 it was often called Algoma West from the name of the provincial constituency established in 1885.
The following districts include areas that were formerly part of Thunder Bay District:
- Rainy River, created in 1885
- Kenora, created in 1907 from Rainy River District
- Cochrane, created in 1921
Subdivisions
Municipalities
- City of Thunder Bay
- Municipality of Greenstone
- Town of Marathon
- Township of Conmee
- Township of Dorion
- Township of Gillies
- Township of Manitouwadge
- Municipality of Neebing
- Township of Nipigon
- Township of O'Connor
- Oliver Paipoonge Municipality
- Township of Red Rock
- Township of Schreiber
- Township of Shuniah
- Township of Terrace Bay
First Nations and their Reserves
- Animbiigoo Zaagi'igan Anishinaabek First Nation: Lake Nipigon
- Aroland First Nation: Aroland Settlement (Aroland 83)
- Biinjitiwaabik Zaaging Anishinaabek First Nation (Rocky Bay): Rocky Bay 1
- Bingwi Neyaashi Anishinaabek First Nation (Sand Point)
- Fort William First Nation: Fort William 52
- Ginoogaming First Nation: Ginoogaming (Long Lac 77)
- Kiashke Zaaging Anishinaabek First Nation (Gull Bay): Gull River 55
- Lac des Mille Lacs First Nation: Lac des Mille Lacs 22A1, Seine River 22A2
- Long Lake 58 First Nation: Long Lake 58
- Namaygoosisagagun First Nation (non-status)
- Netmizaaggamig Nishnaabeg: Pic Mobert North, Pic Mobert South
- Ojibway Nation of Saugeen First Nation (Savant Lake): Ojibway Nation of Saugeen
- Ojibways of the Pic River First Nation: Pic River 50
- Pays Plat First Nation: Pays Plat 51
- Red Rock First Nation (Lake Helen): Lake Helen 53A, Red Rock 53
- Seine River First Nation: Seine River 23A, Seine River 23B
- Whitesand First Nation: Armstrong Settlement, Whitesand
Unorganized areas
- Thunder Bay, Unorganized (including the local services boards of Armstrong, East Gorham, Hurkett, Kaministiquia, Lappe, Nolalu, Rossport, Savant Lake, Shebandowan, and Upsala)
Demographics
As a census division in the 2021 Census of Population conducted by Statistics Canada, the Thunder Bay District had a population of 146,862 living in 64,601 of its 72,510 total private dwellings, a change of 0.6% from its 2016 population of 146,048. With a land area of 102,895.48 km2 (39,728.17 sq mi), it had a population density of 1.4/km2 (3.7/sq mi) in 2021.[2]
| 2021 | 2016 | 2011 | |
|---|---|---|---|
| Population | 146,862 (+0.6% from 2016) | 146,048 (0.0% from 2011) | 146,057 (−2.0% from 2006) |
| Land area | 102,895.48 km2 (39,728.17 sq mi) | 103,722.82 km2 (40,047.60 sq mi) | |
| Population density | 1.4/km2 (3.6/sq mi) | 1.4/km2 (3.6/sq mi) | |
| Median age | 44.8 (M: 43.2, F: 46.0) | 45.0 (M: 44.0, F: 45.9) | |
| Private dwellings | 72,510 (total) 64,601 (occupied) | 72,551 (total) 62,999 (occupied) | 71,235 (total) |
| Median household income | $79,500 | $68,062 |
|
|
| |||||||||||||||||||||||||||||||||||||||||||||||||||||||||||||||
| Population counts are not adjusted for boundary changes. Source: Statistics Canada[2][8][9] | |||||||||||||||||||||||||||||||||||||||||||||||||||||||||||||||||
Further reading
- Arthur, Elizabeth. Thunder Bay District, 1821-1892: A Collection of Documents. Toronto: Champlain Society Publications, 1973.
- Scollie, Frederick Brent. Biographical dictionary and history of Victorian Thunder Bay (1850-1901)) including Prince Arthur’s Landing, Port Arthur, Fort William, Neebing, Nipigon, McIntyre, Oliver, Paipoonge, Rossport, Savanne, Schreiber, Shuniah, and Silver Islet. Thunder Bay, Ont.: Thunder Bay Historical Museum Society, 2020. ISBN 978-0-920119-88-4.
See also
- Edward Island (Lake Superior)
- Esnagami Lake
- List of Ontario Census Divisions
- List of townships in Ontario
- List of secondary schools in Ontario#Thunder Bay District
References
- ^ https://www.ourcommons.ca/members/en/marcus-powlowski(105437)
- ^ a b c d "Thunder Bay, District (DIS) Census Profile, 2021 Census of Population". www12.statcan.gc.ca. Government of Canada - Statistics Canada. Retrieved 17 December 2024.
- ^ Compilation of Northwestern Ontario's 2006 census data
- ^ "Ontario-Manitoba Boundary Case". Archived from the original on 2012-10-04.
- ^ "2021 Community Profiles". 2021 Canadian census. Statistics Canada. February 4, 2022. Retrieved 2024-12-17.
- ^ "2016 Community Profiles". 2016 Canadian census. Statistics Canada. August 12, 2021. Retrieved 2019-07-13.
- ^ "2011 Community Profiles". 2011 Canadian census. Statistics Canada. March 21, 2019. Retrieved 2012-03-20.
- ^ 1996, 2001, 2006, 2011 census
- ^ "1971 Census of Canada - Population Census Subdivisions (Historical)". Catalogue 92-702 Vol I, part 1 (Bulletin 1.1-2). Statistics Canada: 76, 139. July 1973.
External links
 Media related to Thunder Bay District, Ontario at Wikimedia Commons
Places adjacent to Thunder Bay District | |
|---|---|
Subdivisions of Ontario | |
|---|---|
| Counties | |
| Districts | |
| Regional municipalities | |
| Single-tier municipalities | |
| Separated municipalities | |
| Regions | |
| |
, Ontario | ||
|---|---|---|
| Cities | 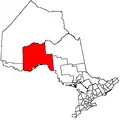 | |
| Towns | ||
| Townships |
| |
| First Nations |
| |
| First Nations reserves |
| |
| First Nations settlements |
| |
| Unorganized areas | ||
| Local services boards | ||
| Unincorporated communities |
| |
| ||