Washington's 7th congressional district
| Washington's 7th congressional district | |
|---|---|
Interactive map of district boundaries since January 3, 2023, with Seattle highlighted in red. | |
| Representative | |
| Population (2023) | 773,546 |
| Median household income | $123,358[1] |
| Ethnicity |
|
| Cook PVI | D+39[2] |
.svg.png)
Washington's 7th congressional district encompasses most of Seattle and Burien, and all of Vashon Island, Lake Forest Park, Shoreline, and Normandy Park. Since 2017, the 7th district has been represented in the U.S. House of Representatives by Democrat Pramila Jayapal. With a Cook Partisan Voting Index rating of D+39, it is the most Democratic district in Washington, and is in a three-way tie for second most Democratic district in the entire United States.[2]
The 7th is the most Democratic district in the Pacific Northwest, and the most Democratic district on the West Coast outside the San Francisco Bay Area. It is also the most Democratic majority-white district in the United States. Democrats dominate every level of government, and routinely win elections with well over 80% of the vote in this district. Barack Obama swept the district in 2008 and 2012, with 82% and 83% of the vote, respectively. Hillary Clinton won the district with 83% in 2016, Joe Biden received 86% in the district in 2020, and Kamala Harris received 85% here in 2024.
Washington's seventh seat in the U.S. House was added after the 1950 census, but the state did not immediately reapportion. It was contested as a statewide at-large seat in three elections, 1952, 1954, and 1956, and voters cast ballots for two congressional seats, their district and the at-large. Democrat Donald H. Magnuson won all three at-large elections. The 1958 election was the first after the state reapportioned to seven districts; Magnuson was elected to the new district in 1958 and 1960, but lost in 1962.
Recent election results from statewide races
| Year | Office | Results[3][4][5] |
|---|---|---|
| 2008 | President | Obama 82% - 17% |
| 2010 | Senate | Murray 79% - 21% |
| 2012 | President | Obama 83% - 17% |
| 2016 | President | Clinton 83% - 11% |
| Senate | Murray 84% - 16% | |
| Governor | Inslee 80% - 20% | |
| Lt. Governor | Habib 82% - 18% | |
| Secretary of State | Podlodowski 71% - 29% | |
| Auditor | McCarthy 76% - 24% | |
| 2018 | Senate | Cantwell 86% - 14% |
| 2020 | President | Biden 86% - 11% |
| Governor | Inslee 86% - 14% | |
| Secretary of State | Tarleton 69% - 31% | |
| Treasurer | Pellicciotti 78% - 22% | |
| Auditor | McCarthy 85% - 15% | |
| Attorney General | Ferguson 84% - 16% | |
| 2022 | Senate | Murray 87% - 13% |
| Secretary of State (Spec.) | Hobbs 75% - 24% | |
| 2024 | President | Harris 85% - 11% |
| Senate | Cantwell 86% - 13% | |
| Governor | Ferguson 84% - 16% | |
| Lt. Governor | Heck 85% - 15% | |
| Secretary of State | Hobbs 88% - 12% | |
| Treasurer | Pellicciotti 85% - 14% | |
| Auditor | McCarthy 86% - 13% | |
| Attorney General | Brown 84% - 16% | |
| Commissioner of Public Lands | Upthegrove 79% - 21% |
Composition
For the 118th and successive Congresses (based on redistricting following the 2020 census), the district contains all or portions of the following counties and communities:[6]
King County (8)
- Boulevard Park, Burien, Lake Forest Park, Normandy Park, Seattle (part; also 9th), Shoreline, Vashon, White Center
List of members representing the district
| Member | Party | Dates | Cong ress |
Electoral history | District location |
|---|---|---|---|---|---|
| District established January 3, 1959 | |||||
 Donald H. Magnuson (Seattle) |
Democratic | January 3, 1959 – January 3, 1963 |
86th 87th |
Redistricted from the at-large district and re-elected in 1958. Re-elected in 1960. Lost re-election. |
1959–1961 [data missing] |
| 1961–1969 [data missing] | |||||
 K. William Stinson (Bellevue) |
Republican | January 3, 1963 – January 3, 1965 |
88th | Elected in 1962. Lost re-election. | |
 Brock Adams (Seattle) |
Democratic | January 3, 1965 – January 22, 1977 |
89th 90th 91st 92nd 93rd 94th 95th |
Elected in 1964. Elected in 1966. Elected in 1968. Elected in 1970. Elected in 1972. Elected in 1974. Elected in 1976. Resigned to become U.S. Secretary of Transportation. | |
| 1969–1973 Parts of King | |||||
| 1973–1983 [data missing] | |||||
| Vacant | January 22, 1977 – May 17, 1977 |
95th | |||
 John E. Cunningham (Seattle) |
Republican | May 17, 1977 – January 3, 1979 |
Elected to finish Adams's term. Lost re-election. | ||
 Mike Lowry (Renton) |
Democratic | January 3, 1979 – January 3, 1989 |
96th 97th 98th 99th 100th |
Elected in 1978. Re-elected in 1980. Re-elected in 1982. Re-elected in 1984. Re-elected in 1986. Retired to run for U.S. Senator. | |
| 1983–1985 [data missing] | |||||
| 1985–1993 [data missing] | |||||
 Jim McDermott (Seattle) |
Democratic | January 3, 1989 – January 3, 2017 |
101st 102nd 103rd 104th 105th 106th 107th 108th 109th 110th 111th 112th 113th 114th |
Elected in 1988. Re-elected in 1990. Re-elected in 1992. Re-elected in 1994. Re-elected in 1996. Re-elected in 1998. Re-elected in 2000. Re-elected in 2002. Re-elected in 2004. Re-elected in 2006. Re-elected in 2008. Re-elected in 2010. Re-elected in 2012. Re-elected in 2014. Retired. | |
| 1993–2003 Parts of King | |||||
2003–2013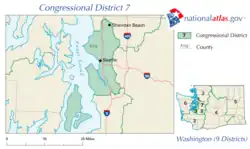 Parts of King | |||||
2013–2023.tif.png) Parts of King and Snohomish | |||||
.jpg) Pramila Jayapal (Seattle) |
Democratic | January 3, 2017 – present |
115th 116th 117th 118th 119th |
Elected in 2016. Re-elected in 2018. Re-elected in 2020. Re-elected in 2022. Re-elected in 2024. | |
2023–present_(new_version).svg.png) Parts of King | |||||
Recent election results
2012
| Party | Candidate | Votes | % | |
|---|---|---|---|---|
| Democratic | Jim McDermott (Incumbent) | 298,368 | 79.6 | |
| Republican | Ron Bemis | 76,212 | 20.4 | |
| Total votes | 374,580 | 100.0 | ||
2014
| Party | Candidate | Votes | % | |
|---|---|---|---|---|
| Democratic | Jim McDermott (incumbent) | 203,954 | 81.0 | |
| Republican | Craig Keller | 47,921 | 19.0 | |
| Total votes | 251,875 | 100.0 | ||
| Democratic hold | ||||
2016
| Party | Candidate | Votes | % | |
|---|---|---|---|---|
| Democratic | Pramila Jayapal | 212,010 | 56.0 | |
| Democratic | Brady Walkinshaw | 166,744 | 44.0 | |
| Total votes | 378,754 | 100.0 | ||
| Democratic hold | ||||
2018
| Party | Candidate | Votes | % | |
|---|---|---|---|---|
| Democratic | Pramila Jayapal (incumbent) | 329,800 | 83.6 | |
| Republican | Craig Keller | 64,881 | 16.4 | |
| Total votes | 394,681 | 100.0 | ||
| Democratic hold | ||||
2020
| Party | Candidate | Votes | % | |
|---|---|---|---|---|
| Democratic | Pramila Jayapal (incumbent) | 387,109 | 83.0 | |
| Republican | Craig Keller | 78,240 | 16.8 | |
| Write-in | 1,113 | 0.2 | ||
| Total votes | 466,462 | 100.0 | ||
| Democratic hold | ||||
2022
| Party | Candidate | Votes | % | |
|---|---|---|---|---|
| Democratic | Pramila Jayapal (incumbent) | 295,998 | 85.4 | |
| Republican | Cliff Moon | 49,207 | 14.2 | |
| Write-in | 1,442 | 0.4 | ||
| Total votes | 346,647 | 100.0 | ||
| Democratic hold | ||||
2024
| Party | Candidate | Votes | % | |
|---|---|---|---|---|
| Democratic | Pramila Jayapal (incumbent) | 352,286 | 83.9 | |
| Republican | Dan Alexander | 66,220 | 15.8 | |
| Write-in | 1,313 | 0.3 | ||
| Total votes | 419,819 | 100.0 | ||
| Democratic hold | ||||
Historical district boundaries

See also
- United States House of Representatives elections in Washington, 2008
- United States House of Representatives elections in Washington, 2010
- United States House of Representatives elections in Washington, 2012
References
- ^ "My Congressional District".
- ^ a b "2025 Cook PVI℠: District Map and List (119th Congress)". Cook Political Report. Retrieved April 5, 2025.
- ^ "DRA 2020". Daves Redistricting. Retrieved January 20, 2025.
- ^ "2022Gen Results by Congressional District" (PDF). sos.wa.gov. Archived (PDF) from the original on December 29, 2022.
- ^ "2024Gen Results by Congressional District" (PDF). sos.wa.gov. Archived (PDF) from the original on December 28, 2024.
- ^ https://www2.census.gov/geo/maps/cong_dist/cd118/cd_based/ST53/CD118_WA07.pdf
- ^ "Federal - All Results". Washington Secretary of State. Retrieved November 27, 2012.
- ^ "Federal - All Results". Washington Secretary of State. November 4, 2014. Retrieved December 8, 2014.
- ^ "November 8, 2016 General Election Results". Washington Secretary of State. Retrieved December 3, 2016.
- ^ Johnson, Cheryl L. (February 28, 2019). "Statistics of the Congressional Election of November 6, 2018". Clerk of the U.S. House of Representatives. Retrieved April 27, 2019.
- ^ "Official Canvass of the Returns" (PDF). Secretary of State of Washington. Retrieved December 3, 2024.
- ^ "Official Canvass of the Returns" (PDF). Secretary of State of Washington. Retrieved December 3, 2024.
- ^ "Official Canvass of the Returns" (PDF). Secretary of State of Washington. Retrieved December 4, 2024.
Further reading
- Martis, Kenneth C. (1989). The Historical Atlas of Political Parties in the United States Congress. New York: Macmillan Publishing Company.
- Martis, Kenneth C. (1982). The Historical Atlas of United States Congressional Districts. New York: Macmillan Publishing Company.
- Congressional Biographical Directory of the United States 1774–present Archived April 23, 2010, at the Wayback Machine