Here is my htop output:
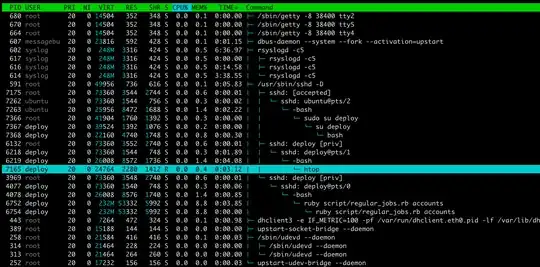
For example, I'm confused by this ruby script:
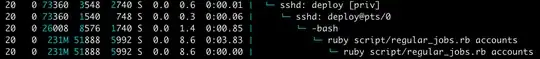
How much physical memory is it using? 3+1+8+51+51? 51? 51+51?
Here is my htop output:
For example, I'm confused by this ruby script:
How much physical memory is it using? 3+1+8+51+51? 51? 51+51?
Hide user threads (shift + H) and close the process tree view (F5), then you can sort out the process of your interest by PID and read the RES column (sort by MEM% by pressing shift + M, or F3 to search in cmd line)
Memory is a hard thing, you cannot calculate used physical memory by just running ps/htop/top. Memory can be shared between processes.
I recommend you to check usage with this script:
Take a look at the Column RES and SHR.
RES - SHR = Total estimated memory usage by the process.
From this gist:
VIRT: How much virtual memory the process is using.
RES: How much physical RAM the process is using, measured in kilobytes.
SHR: How much shared memory the process is using.
From this blog (unfortunately the link is invalid now):
VIRT stands for the virtual size of a process, which is the sum of memory it is actually using, memory it has mapped into itself (for instance the video card’s RAM for the X server), files on disk that have been mapped into it (most notably shared libraries), and memory shared with other processes. VIRT represents how much memory the program is able to access at the present moment.
RES stands for the resident size, which is an accurate representation of how much actual physical memory a process is consuming. (This also corresponds directly to the %MEM column.) This will virtually always be less than the VIRT size, since most programs depend on the C library.